
Donor retention is the share of last year’s donors who give again this year. Your donor retention rate is the number who gave in both periods divided by the number who gave in the earlier one. For an Australian charity with a regular giving program, the bigger risk is the first year, and some of those donors never chose to leave.
Key takeaways
- The Fundraising Effectiveness Project’s Q4 2025 report put overall US donor retention at 43.3% for 2025, up from 43.1%, with the rise coming from repeat donors while new-donor retention stayed mostly unchanged (Neon One, 8 June 2026; DonorPerfect, 17 July 2026).
- Research by Frost & Sullivan for the ACCC (November 2017) found Australian charities expected to lose about 50% of new regular donors within 12 months, and nearly 60% of those within three months of signing up.
- The same ACCC research (November 2017) found that a regular donor gives for about five years on average, which is the giving each early cancellation puts at risk.
Updated October 2026
How to calculate donor retention rate
The formula is simple:
Donor retention rate = donors who gave in the last 12 months and in the 12 months before ÷ donors who gave in the 12 months before
Count donors, not gifts, and use rolling 12-month windows so you can report it every quarter instead of once a year. Then split it three ways, because a single blended rate hides where the loss is:
- First-year and repeat donors separately. Someone on their second or fifth year of giving behaves very differently from someone who gave for the first time last year. Mixing them flatters the rate while new donors drain away.
- Regular givers by cohort. Group everyone who started a monthly gift in the same quarter, then track how many stopped within 3 months and within 12 months. A cohort view shows whether a change (a new welcome contact, a new channel, a new payment provider) helped or hurt, months before the annual rate moves.
- Lapsed by reason. Agree what “lapsed” means before you count. For regular givers, a sensible rule is a cancellation, or two debits in a row that failed and weren’t recovered. Then record which of the two it was.
Retention measures, defined
| Measure | Calculation | Notes |
|---|---|---|
| Donor retention rate | The formula above, on rolling 12-month windows | The headline; report it every quarter, not once a year |
| First-year retention | Of donors whose first gift was 12–24 months ago, the share who gave again in the last 12 months | Where most of the loss is |
| Lost within 3 months (regular givers) | Regular givers who stopped within 3 months of joining ÷ new regular givers, by quarter joined | The welcome period |
| Lost within 12 months (regular givers) | As above, within 12 months | Compare with “about half” from the ACCC research |
| Involuntary lapse | Regular givers lapsed after failed payments that weren’t recovered ÷ all lapsed regular givers | Often fixable with a payment retry and a phone call |
| Lifetime value at stake | Annual value × expected remaining years, for lapsed givers you can still contact | Puts the most valuable donors at the top of the list to call |
What is the average donor retention rate?
The most quoted benchmark is American. The Fundraising Effectiveness Project, which tracks a large panel of US nonprofits, reported overall donor retention of 43.3% for 2025, up slightly from 43.1% (Neon One, 8 June 2026; DonorPerfect, 17 July 2026). The small rise came from repeat donors. First-time donor retention stayed flat or slipped, and remains far below the overall figure: turning a first gift into a second is still the hardest step.
The Australian figure for regular givers comes from research by Frost & Sullivan for the ACCC, published in November 2017. Charities told the researchers they expect to lose about 50% of new regular donors in the first 12 months, and nearly 60% of those within the first three months. They also said a regular donor gives for about five years on average. The research is from 2017, so treat it as a planning figure rather than a current benchmark, and measure your own.
The two numbers measure different things. The US figure covers all donors, most of them one-off givers. The Australian one is about new monthly donors, many recruited on the street or by phone (the research looked at commission-based fundraising). Compare your own figures with the benchmark that measures the same thing: overall retention with the FEP, new regular givers with the ACCC research.
Why do new regular givers leave?
Three causes account for most of the early loss, and only one of them is a donor changing their mind.
The acquisition channel. A donor who signed up on the street or over the phone made the decision in a few minutes, often with a stranger. A donor who found your website or came to your event usually sought you out. Expect the channels to behave differently, and compare loss by channel rather than assuming.
The welcome period. The ACCC research puts most of the first-year loss in the first three months. That’s the window when a new donor sees the first debit on their statement and decides whether it still feels right. A thank-you, a welcome contact and an early story about what their gift does all land in that window, or not at all.
Failed payments. Cards expire, donors change banks, and when a charity changes payment provider some debits don’t carry over cleanly. The donor didn’t cancel; the money just stopped. The sources above don’t split voluntary from involuntary lapses, so this is practice rather than a sourced figure. A payment retry and a phone call recover many of these donors, if someone notices in time. Noticing depends on the payment gateway and the CRM agreeing, which is a data quality question as much as a fundraising one.
What it looks like in a fictional charity
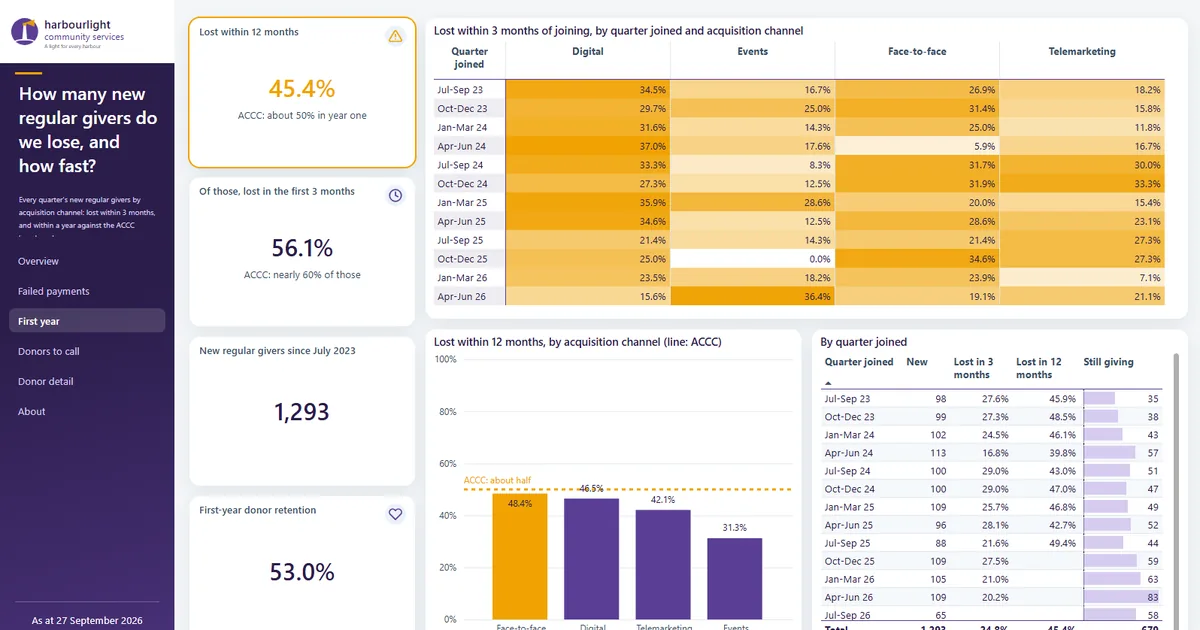
Harbourlight Community Services is a fictional charity built on typical sector data, and its reports use a 1-in-20 sample of its donors. Since July 2023 it has recruited 1,293 new regular givers in the sample. Of those who have had a full year, it lost 45.4% within 12 months, close to the ACCC’s “about half”. Of the givers it lost, 56.1% went in the first three months, close to “nearly 60%”. First-year donor retention is 53.0%.
The channel split is where it gets useful. Face-to-face sign-ups lost 48.4% within a year, digital 46.5%, telemarketing 42.1% and events 31.3%. The heatmap shows each quarter’s cohort, so a bad quarter in one channel stands out instead of disappearing into an annual average.
Click a screen to see it full size.
How many new regular givers do we lose, and how fast?
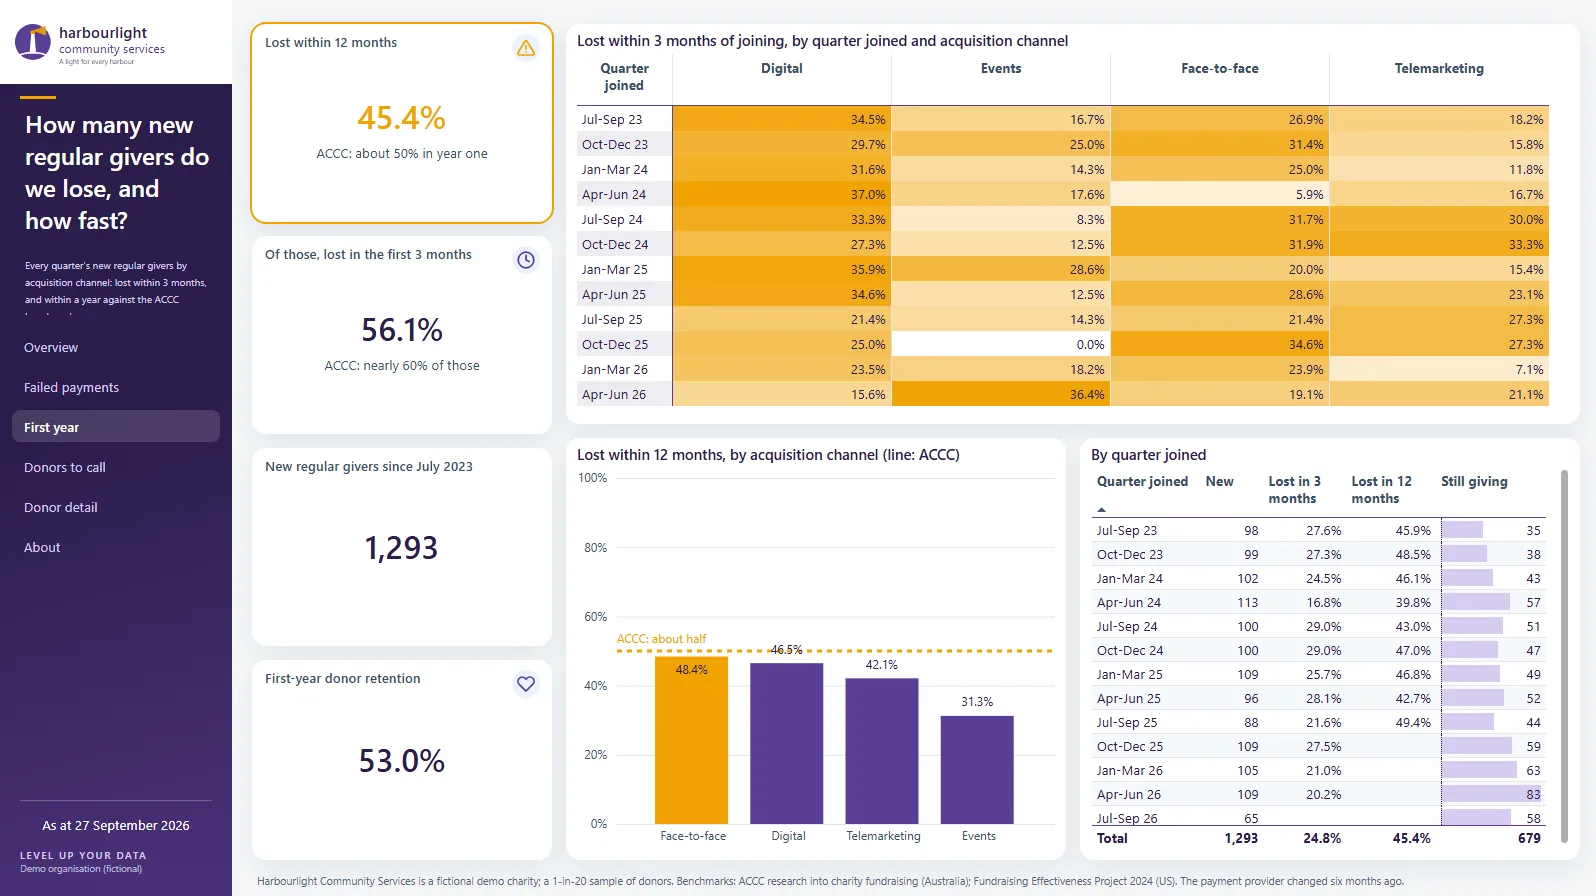
Harbourlight Community Services is fictional; figures are illustrative.
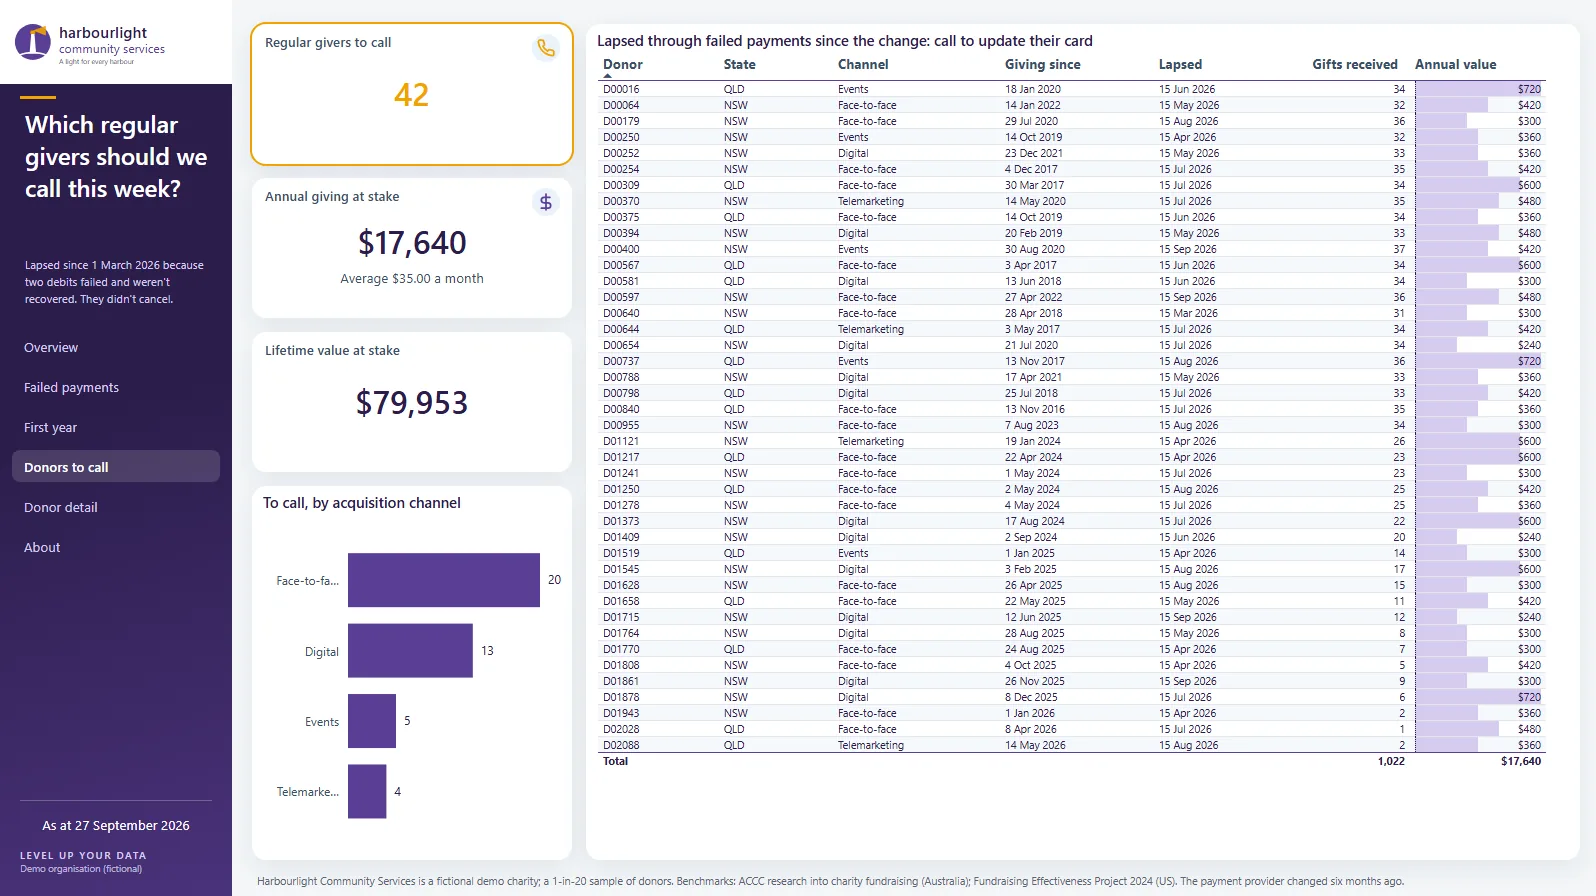
Six months before the report date, Harbourlight changed payment provider. Since 1 March 2026, regular givers in the sample have lapsed because two debits failed and weren’t recovered. They didn’t cancel. The report turns them into a list for supporter care: 42 regular givers to phone this week. That is AUD 17,640 of annual giving (about AUD 35 a month each) and AUD 79,953 of lifetime value at stake. Nearly half came through face-to-face fundraising, and many had been giving for years.
Which regular givers should we call this week?
This report sits with five others, all on the same fictional charity, on our not-for-profit data analytics page.
Which monthly measures improve regular giving retention?
The headline rate is a quarterly figure, and the table above is the reference. Each month, add two numbers it doesn’t cover:
- New regular givers, by channel. The top of the funnel, so a fall in one channel shows before it hits income.
- Failed-payment recovery rate. The share of failed debits that succeed on retry or after a phone call. If it slips, you see it within weeks, not in next year’s retention rate.
Then look at the newest cohorts’ loss within 3 months and the share of lapses that were failed payments. Finish with this week’s list to call, the most valuable lapsed givers first.
Most of this already sits in your CRM and your payment gateway. The work is joining them, agreeing the definitions with fundraising and finance, and putting the result where supporter care looks every week.
Questions we’re asked
Overall donor retention across the Fundraising Effectiveness Project’s US panel was 43.3% in 2025, but a good rate depends on your mix of donors. A program built mainly on monthly giving should keep far more of its supporters each year than one built on one-off appeal gifts. The useful test is your own trend: compare first-year and repeat donors separately with the same quarter a year earlier.
Take a worked example. Suppose 2,000 donors gave between July 2024 and June 2025, and 900 of them gave again between July 2025 and June 2026. Retention is 900 ÷ 2,000, or 45%. New donors who first gave after June 2025 don’t count in either number; they start next year’s calculation. Repeat it each quarter on rolling windows.
Many don’t cancel at all. Among those who do, common reasons include a change in their own finances or a sign-up they regret after the first debit. Another common reason is feeling they haven’t heard from the charity since signing up. Others lapse silently when a card expires or a bank account changes. Recording the reason at the point of cancellation is the only way to know your own mix.
Contact new regular givers within their first few weeks, before the first debit raises questions. Retry failed payments automatically, then phone within days rather than months, with an easy way to update card details. Watch cohorts by channel so a weak recruitment source shows early. None of this needs a new CRM; it needs the payment and donor records joined and reviewed every week.
Find the regular givers you can still keep
A fixed-price pilot, 4–6 weeks, scoped with you. Start with a free 30-minute meeting.