
Local government analytics
Local government analytics
Local government data analytics: see which services, projects and budgets are slipping
For councils whose councillors get a stack of separate reports: Power BI reports that join customer requests, finance, capital works, rates and HR, so you see where the council is delivering and where it isn’t.
31%
of Queensland councils met all their financial sustainability ratios in 2024–25. Source: Queensland Audit Office, March 2026
2,194
complaints about councils to the Queensland Ombudsman in 2025–26, up about 19% in a year. Source: Queensland Ombudsman, September 2026
7 of 29
NSW council projects over AUD 30 million were on time and on budget; 14 ran more than six months late. Source: Audit Office of NSW, January 2026
93%
of Queensland councils report occupational shortages, against 83% nationally. Source: Local Government Skills Audit, June 2026
Sector facts as at September 2026.
Report examples
Seven local government data analytics reports on one fictional council
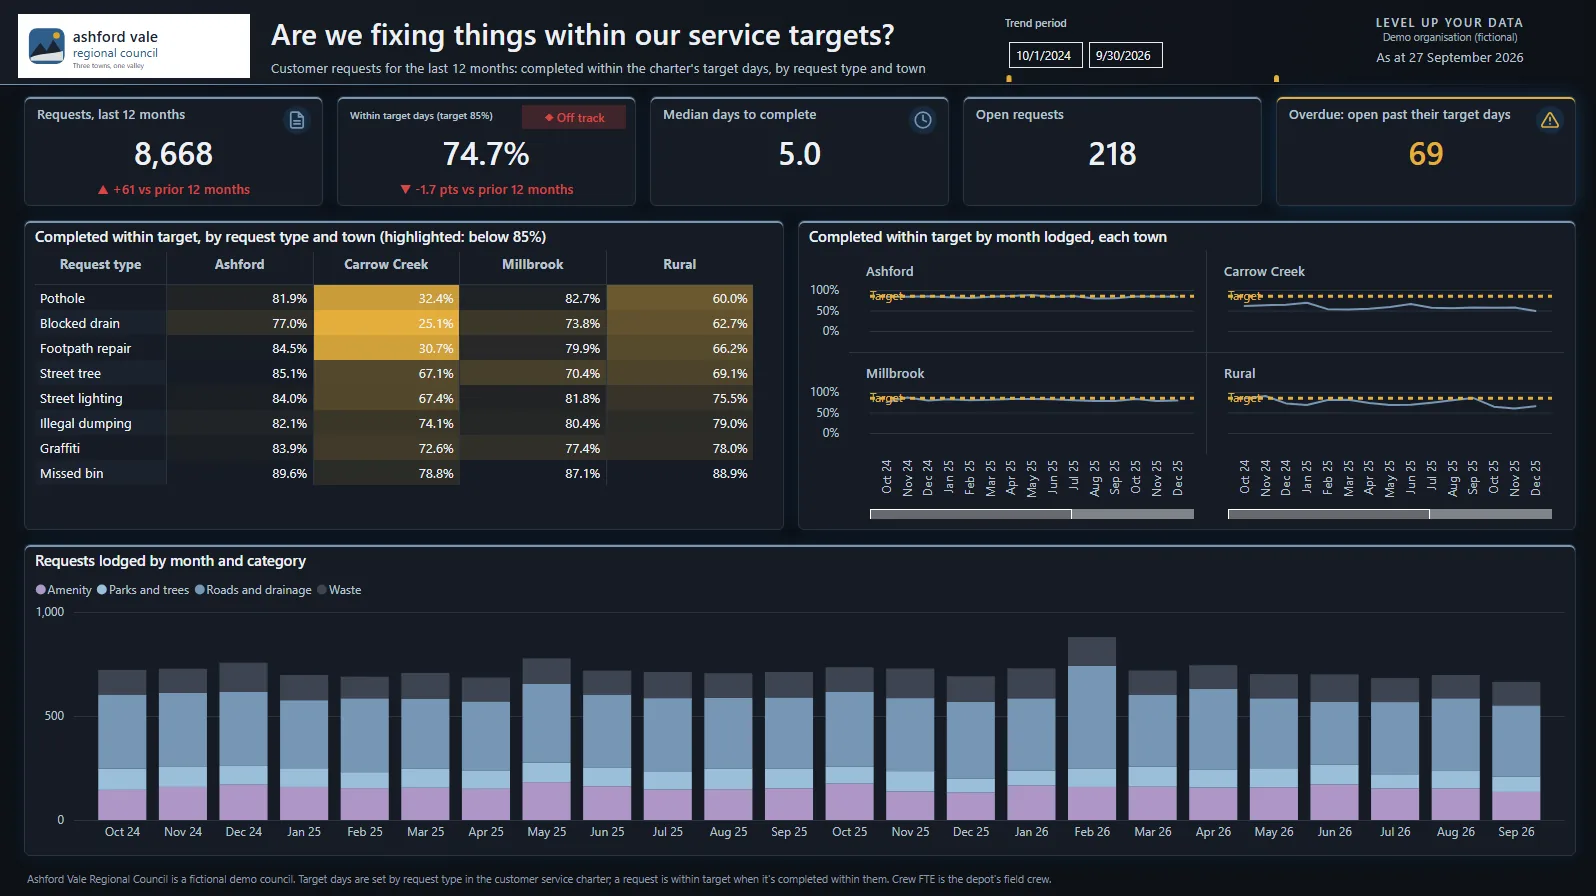
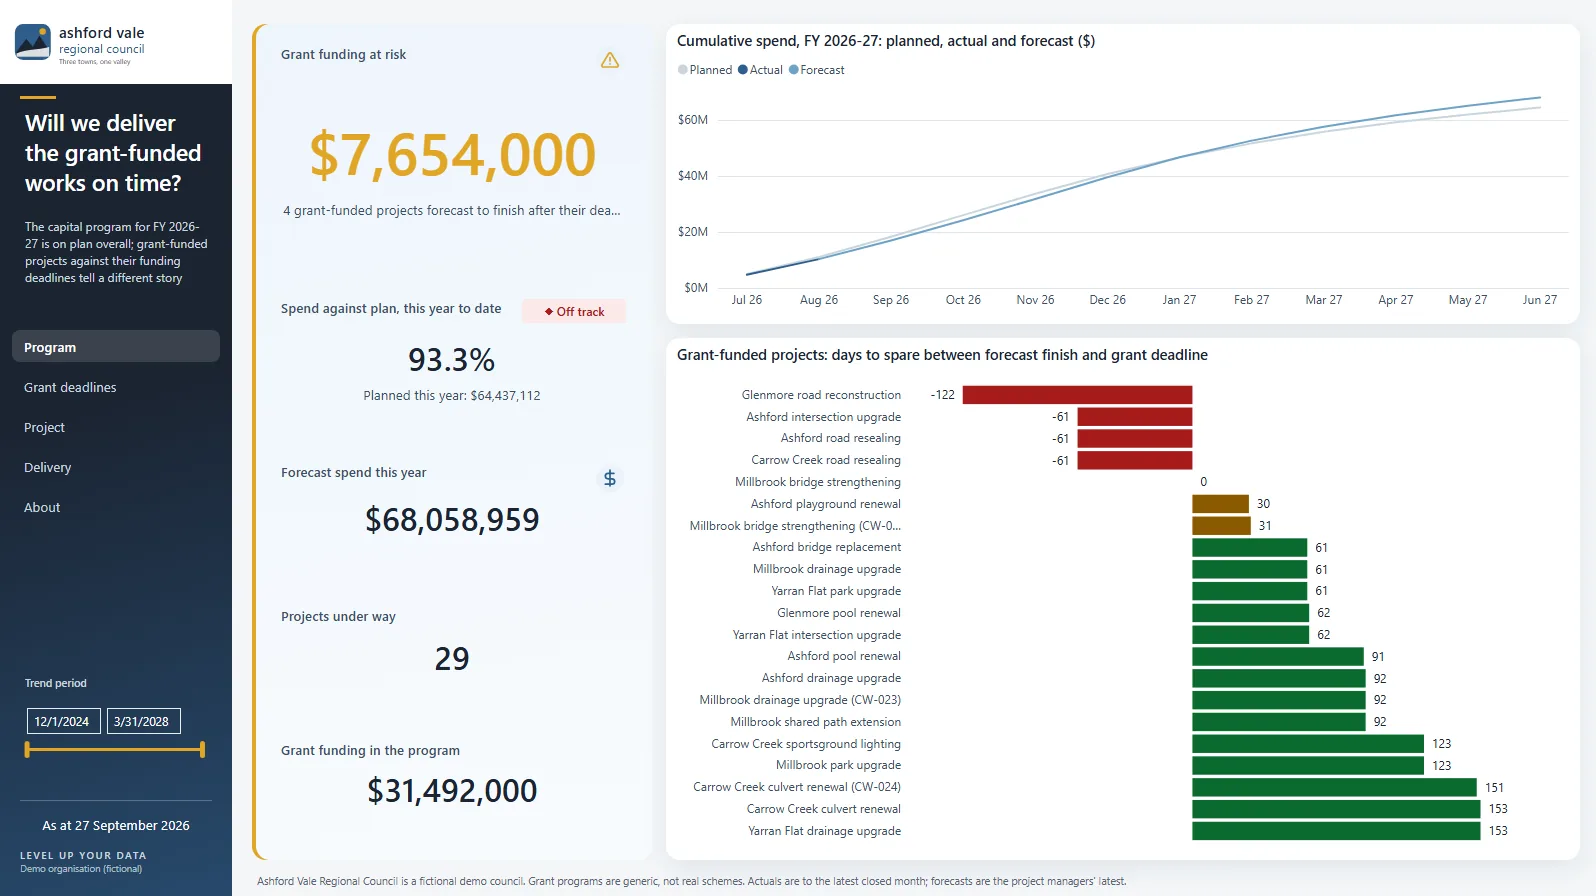
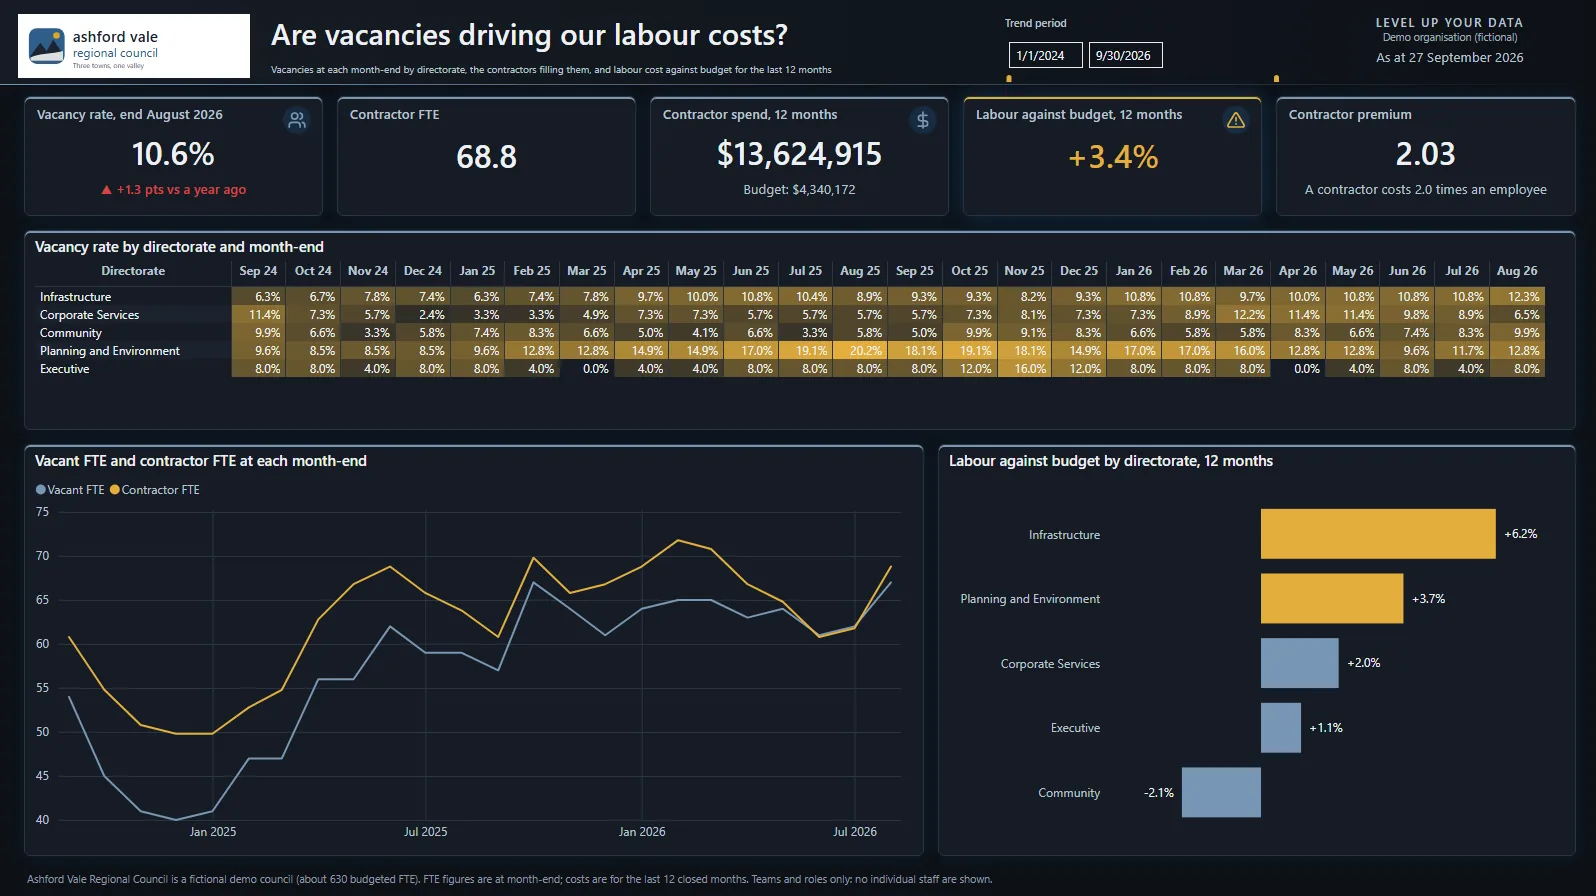
Ashford Vale Regional Council is fictional, built on typical sector data: about 85,000 residents across three towns and rural districts, an operating budget of about AUD 190 million, and a capital program of about AUD 70 million a year, a third of it grant-funded. All seven reports run on it, so the stories join up: Carrow Creek completes only about half its requests on time, four grant-funded road projects are heading past their deadlines, vacancies filled by contractors push labour over budget, and overdue rates have climbed since a hardship policy change.
Click a screen to see it full size.
Council board pack
Councillors and CEO: Is the council delivering, and living within its means? Nine measures across services, finance and people, each against the target council set, with the gaps furthest from target listed first.
Customer requests
Customer service manager: Are we fixing things within our service targets? Requests by type, town and depot, the overdue list and crew capacity: Carrow Creek’s depot handles 264 requests per crew FTE, against 182 in Ashford.
Capital works and grants
Director Infrastructure: Will we deliver the grant-funded works on time? Every project’s days to spare against its grant deadline, the deadlines coming up, and where each late project slipped.
Budget and forecast
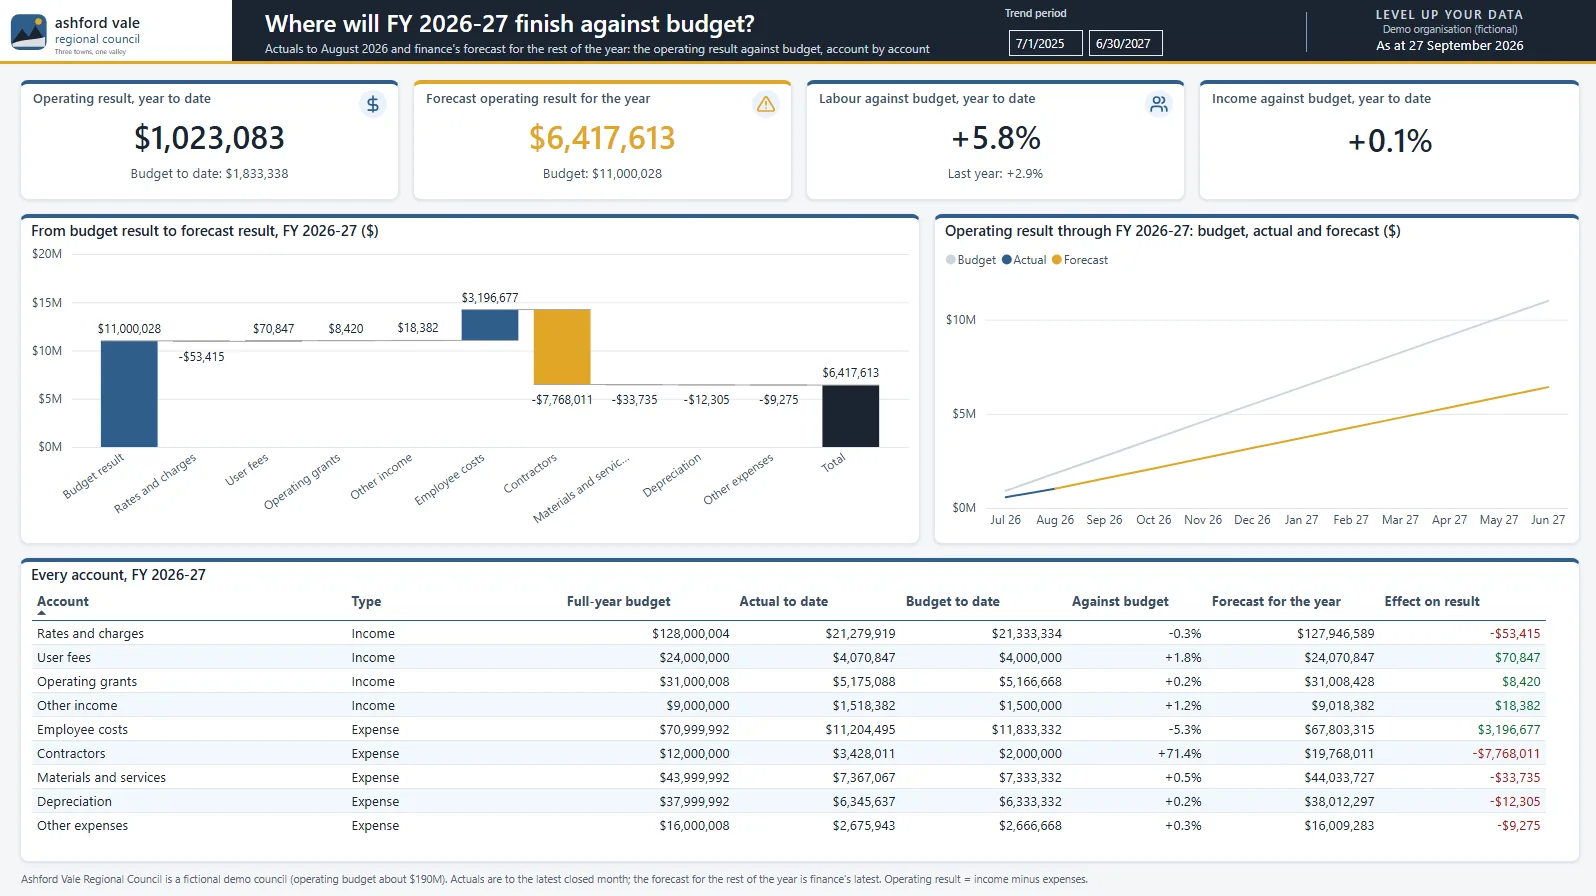
CFO: Where will the year finish against budget? Each directorate’s result, account by account. Labour is 5.8% over budget to date, and was already 2.9% over last year.
Performance pack
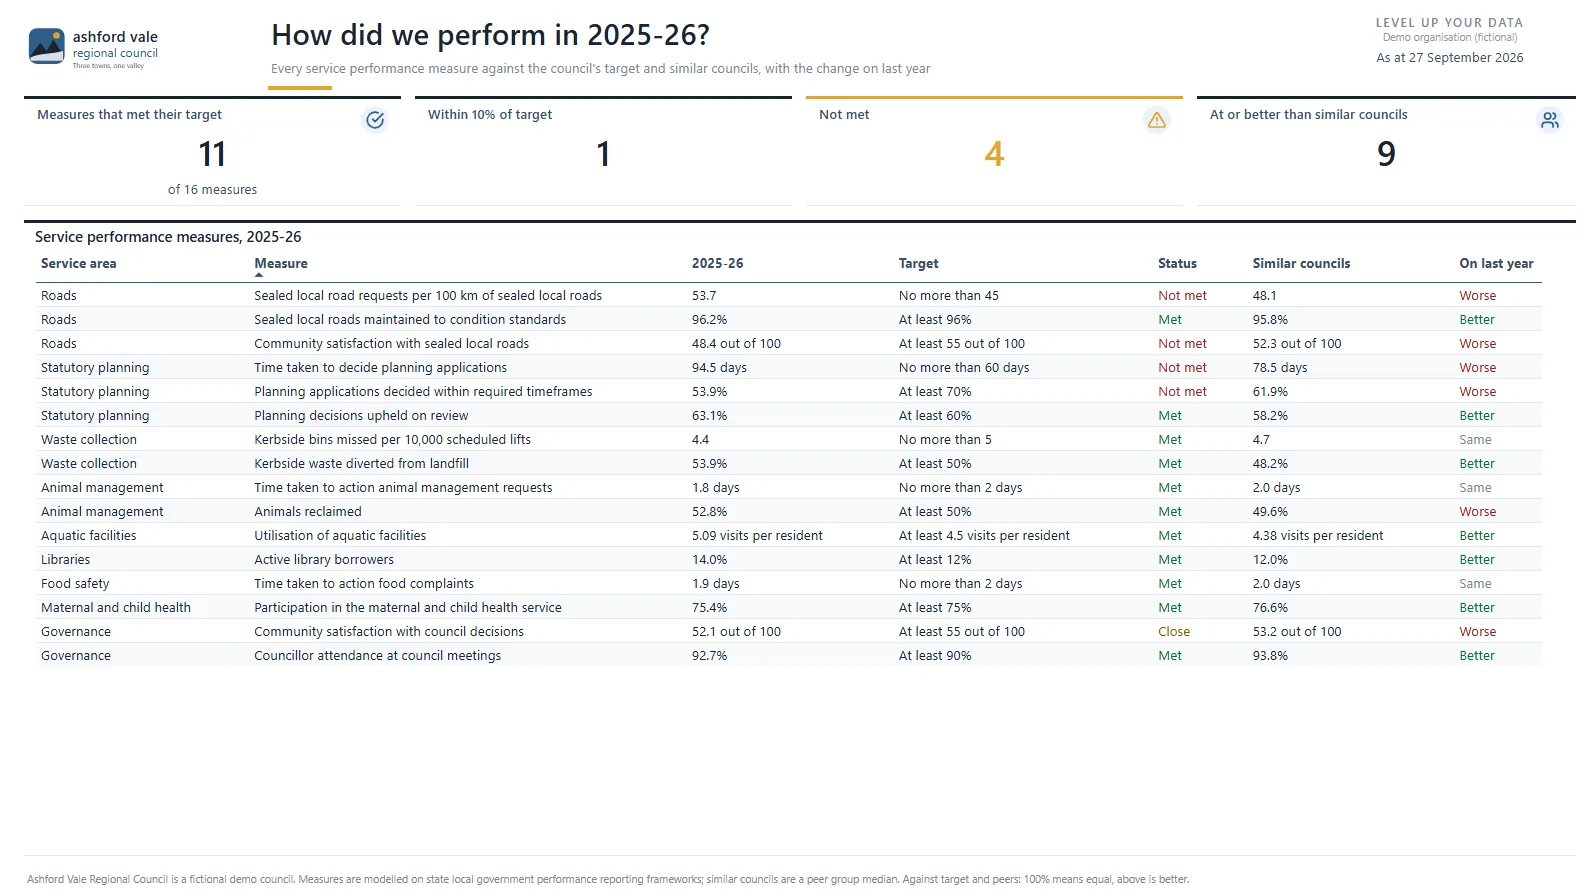
CEO and councillors: How did we perform this year? Every service measure against the council’s target, over five years and against similar councils.
Rates debtors and hardship
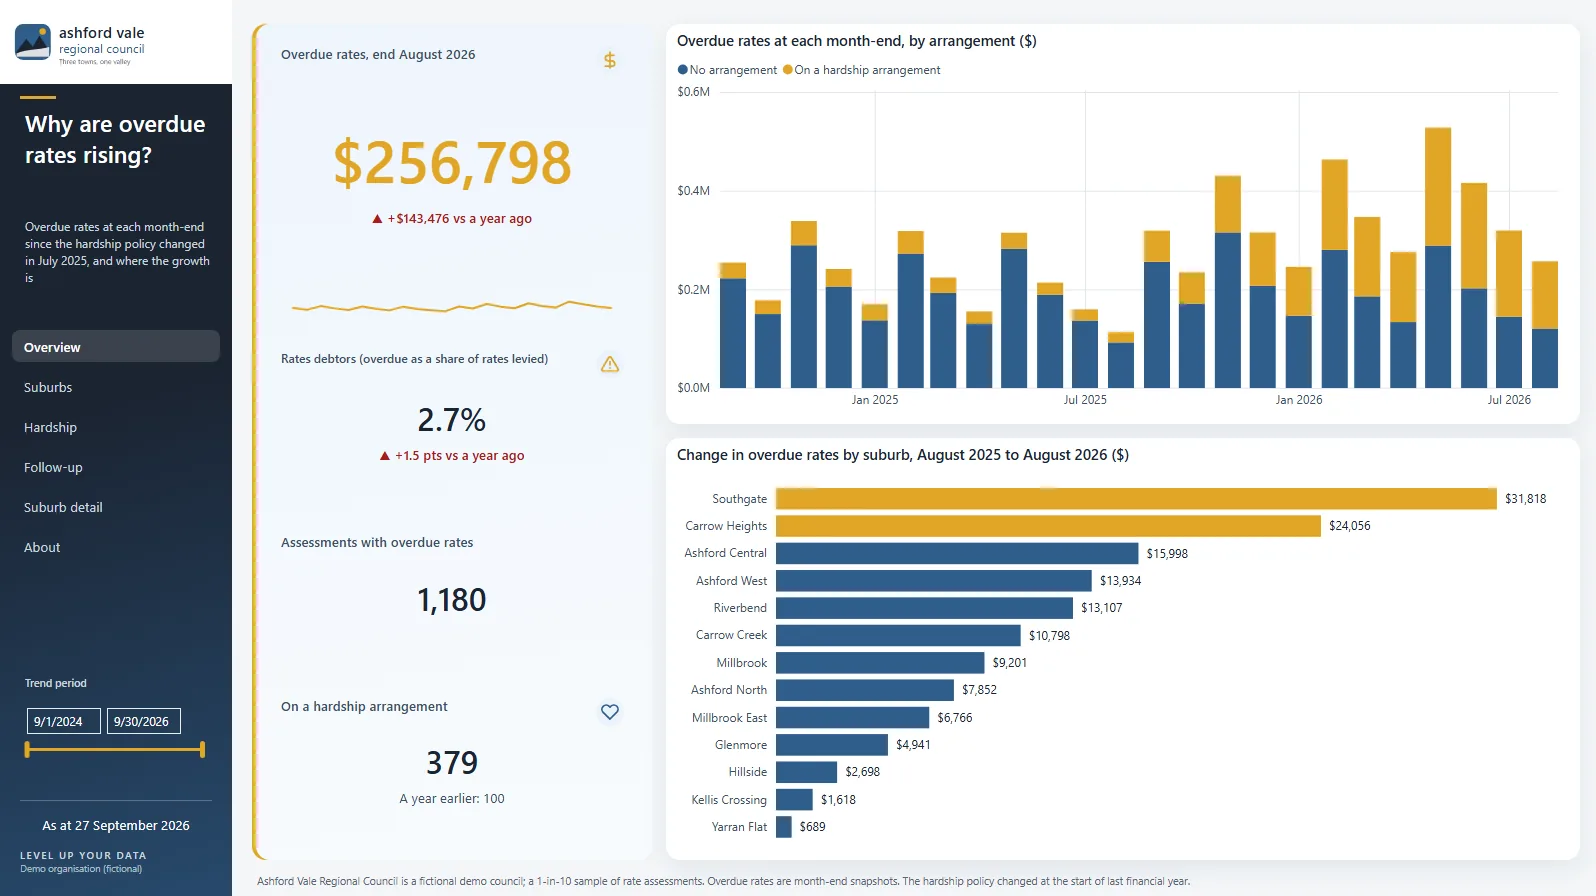
CFO: Why are overdue rates rising? Two suburbs hold 13% of assessments but 39% of the growth, and one hardship arrangement in four has missed a payment.
Workforce
Executive and CFO: Are vacancies driving our labour costs? The roles that can’t be filled and the teams that depend on contractors: engineers take a median 281 days to fill, planners 251.
Sector pressures
Why isn’t a stack of monthly reports enough any more?
Each pressure lives in a different system, and councillors see them in separate papers.
Financial sustainability
Queensland councils report nine sustainability measures against their tier’s benchmarks and forecast them nine years ahead (Queensland Audit Office); NSW rate pegs for 2026–27 are 2.5% to 4.2% (IPART).
Reporting to the state
Queensland CEOs report progress on the operational plan at least every three months (Local Government Regulation 2012); NSW councils report on their Delivery Program at least every six months (Office of Local Government).
Grant-funded capital works
Tied grants are usually paid on milestones, so costs land before revenue, and auditors found grant registers not kept up to date (Audit Office of NSW).
Customer requests and complaints
The NSW Ombudsman finalised 2,907 complaints about councils in 2024–25, up 9% (NSW Ombudsman).
Skills shortages
Two councils in three are understaffed, with average vacancies of 8.4%, and some roles take six months or more to fill (Local Government Skills Audit).
Governance
Data your councillors can trust
The reports connect to the systems you already run: your corporate system for finance, rates and property (such as TechnologyOne or Civica), your customer request system, the capital works register, HR and payroll, and GIS. Data in spreadsheets? We start from the spreadsheets. The model doesn’t change when the source improves.
- Every figure has an owner: the director responsible for each measure, with targets agreed by council and reporting reviewed by the audit and risk committee.
- Reconciled, not assumed: actuals from closed months, reconciled to the general ledger; grant deadlines from the signed agreement, including variations; service measures calculated to the framework’s definitions and checked by a second officer.
- Private by design: no ratepayer or customer names in the model; performance by depot and team, never by named staff; the rates follow-up list visible only to the revenue team.
Read more about our approach to data governance.
The pilot
How does a council pilot work?
A fixed-price pilot, 4–6 weeks, scoped with you in a free 30-minute meeting: one question, answered on your own data and reconciled to your own figures.
Good starting points are customer requests, owned by your customer service manager, or the budget forecast, owned by your CFO. The report is tuned with whoever owns the question. See how we work for the week-by-week plan, and our tested delivery accelerators.
FAQ
Questions councils ask
Corporate system reports stay inside one module: finance, rates or HR. Council questions cross them. Is the labour overspend coming from vacancies filled by contractors? Are slow requests a depot crewing problem? Power BI joins your corporate, customer request, capital works and HR data in one governed model, so those answers sit on one page and nobody rebuilds the councillor papers by hand each month.
No. The council in these reports is fictional, and every figure in them is illustrative; the grant programs are generic, not real schemes. The sector facts on this page come from audit offices, ombudsmen and state regulators, linked and dated. In a pilot, the same reports run on your own data and are checked against the figures you already report.
The measures your council reports. In Queensland that means the financial sustainability measures against your tier’s benchmarks and the operational plan measures in quarterly progress reports. In NSW it means your Delivery Program and Operational Plan measures and the infrastructure asset ratios. In week one we confirm the definitions, the comparison group of similar councils and the targets from your council plan.
The model holds no names or addresses. Rates are tracked by assessment number, requests are counted by type and location, and workforce figures are shown by team and role, with small teams combined. Row-level security limits sensitive lists, such as rates follow-ups, to the team that works them.
Yes. Each measure in the board pack comes from the same governed model as the detailed report behind it, with one definition and one owner. A councillor who asks why requests are off track can open the customer request report and see the town, the request types and the depot behind the number, rather than waiting for a separate briefing paper.
Related
See every service and project in one view
A fixed-price pilot on your own data, 4–6 weeks. Start with a 30-minute meeting.