
Minimum night flow (MNF) is the lowest rate of water flowing into a district metered area (DMA), usually between 2 am and 4 am, when customers use the least. Night use is small and steady, so much of that flow is leakage. When a DMA’s minimum night flow rises above its usual baseline and stays there, that is the earliest sign of a new leak. It often shows weeks before water surfaces or a customer calls.
Key takeaways
- Minimum night flow is the lowest inflow to a district metered area, typically between 2 am and 4 am, when customer use is at its lowest and leakage is a significant share of the inflow (Marzola, Alvisi and Franchini, Water, February 2021).
- Leakage in a DMA is estimated by subtracting a reasonable allowance for customers’ night-time use from the minimum night flow (Marzola, Alvisi and Franchini, Water, February 2021).
- Australian utilities report leakage once a year rather than nightly, as real losses per connection and the infrastructure leakage index, in the Bureau of Meteorology’s National Performance Report (2024–25 report, checked September 2026).
Updated October 2026
The method is well documented. Turning it into a nightly alarm that someone acts on is the harder part. This post covers that part: why night flow works, how to set a baseline and an alarm, and how to turn litres per second into water lost. It ends with the gap between an alarm and a repair crew.
What minimum night flow is, and why it works
A DMA is a part of the network with a fixed boundary and metered inflows, so you can measure exactly how much water goes into it. During the day, customers dominate that inflow: showers, washing machines, gardens, businesses. In the early hours, most of them stop. What still flows in is a small amount of legitimate night use (toilets, appliances, a few known night-time users such as a hospital or a factory on shifts). The rest is leakage, which runs around the clock.
That’s why leakage shows up in the minimum night flow: in those hours customer use is at its minimum and leakage is a significant share of the inflow (Marzola, Alvisi and Franchini, Water, February 2021). Night use changes slowly; a burst service pipe or a cracked main changes the night flow overnight and keeps it there.
Night flow tracks leakage in each DMA every night. The infrastructure leakage index measures it across a whole year (our post on non-revenue water shows how it’s calculated), and it’s the annual figure Australian utilities report, with real losses per connection, in the Bureau of Meteorology’s National Performance Report (2024–25 report, checked September 2026). Both come from the same inflow meters, which is why a utility that already does a water balance by DMA is most of the way to night-flow alarms.
How do you set a baseline and an alarm?
A raw night-flow figure means little on its own. A DMA with 2,000 connections and long mains will always flow more at 3 am than a small one. What matters is the change against that DMA’s own normal night. A night-flow alarm works like this:
A night-flow alarm in six steps
- Meter every DMA’s inflow at 15-minute intervals or finer, and store it.
- Take each night’s minimum between 2 am and 4 am.
- Set a baseline per DMA from recent leak-free nights (for example, their median), and reset it after repairs.
- Alarm when the minimum stays above the baseline by your threshold for several nights, not just one.
- Convert the excess to litres a day (excess L/s × 3,600 × night-day factor) and to cost.
- Join alarms to work orders: every alarm has a job, or a recorded reason it doesn’t.
Two choices in that list are yours to make, not standards. The threshold: the fictional utility in the example below alarms at 1.5 L/s above baseline, which suits its DMA sizes. A large DMA may need a higher one, a small DMA a lower one. Persistence: one high night can be a fire hydrant in use or a meter glitch, so several nights in a row cut false alarms without losing much time.
Step 3 matters more than it looks. If the baseline is never reset after a repair, a DMA that started with a little background leakage keeps it hidden inside “normal”.
How to calculate leakage from night flow
You measure night flow in litres per second, but you count water lost in litres a day. The conversion needs one assumption: the night-day factor, the number of hours a day the night-time excess effectively applies.
It’s usually less than 24, because pressure is highest at night, when demand is lowest, and leaks run faster at higher pressure. A night-time excess overstates the daytime leak rate, so the factor scales it down. Each utility sets its own factor from its pressure profile; the fictional utility below uses 20 hours.
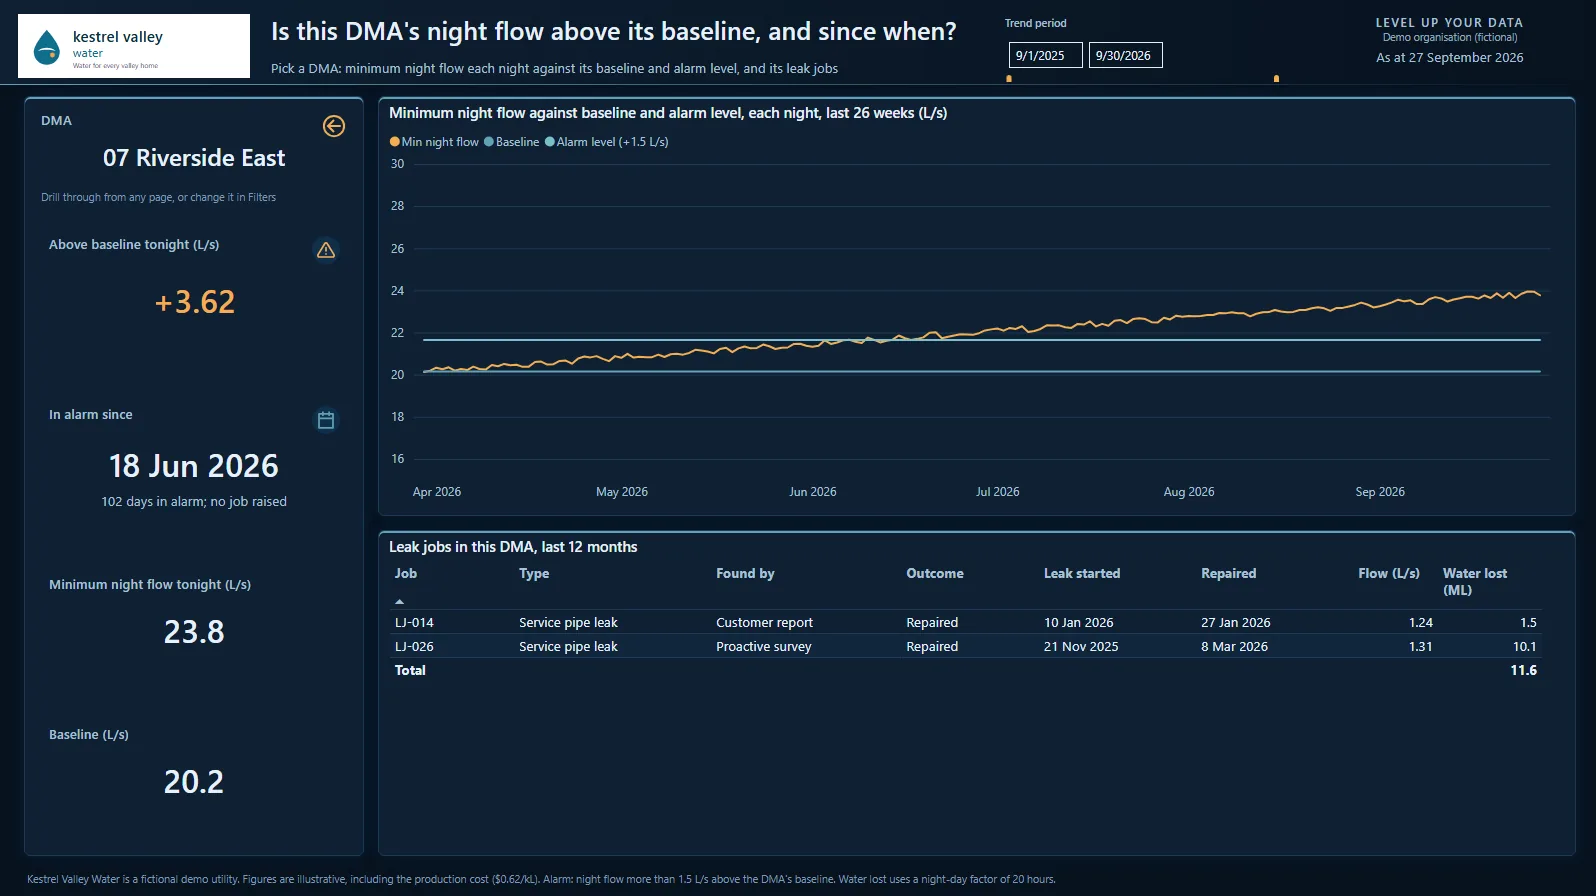
Example (from the report below): an excess of 3.62 L/s × 3,600 seconds × 20 hours = 260,640 litres a day, or about 0.26 ML. Over a month, that’s close to 8 ML from one leak. At the fictional utility’s illustrative production cost of AUD 0.62 a kilolitre, it’s about AUD 160 a day. That is before counting the risk that a slow leak becomes a burst. One day’s loss costs less than a crew day, but hidden leaks run for weeks. Riverside East’s has been in alarm for 102 days and has lost about 19.8 ML since the alarm started. That is roughly AUD 12,300 at the same illustrative cost. Against weeks of loss, a crew this week is the cheaper option.
The gap: alarms without jobs
Many utilities already have night-flow data and some form of alarm. The gap is between the alarm and the crew. The SCADA alarm lives in one system, the work order in another, and nobody has to explain why an alarm has no job.
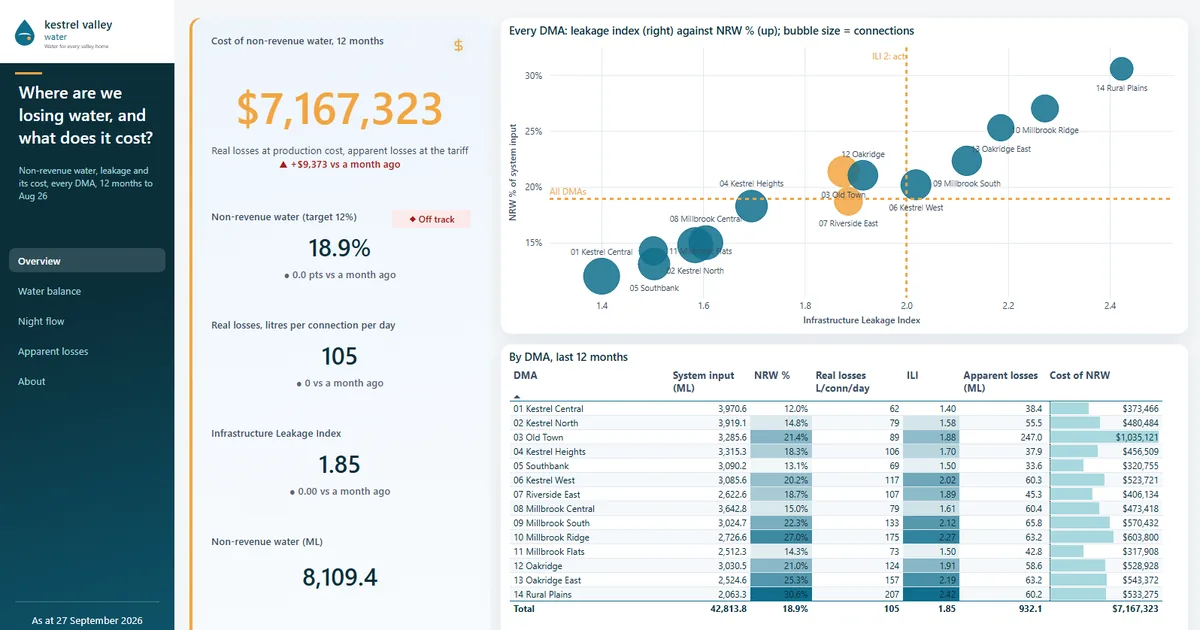
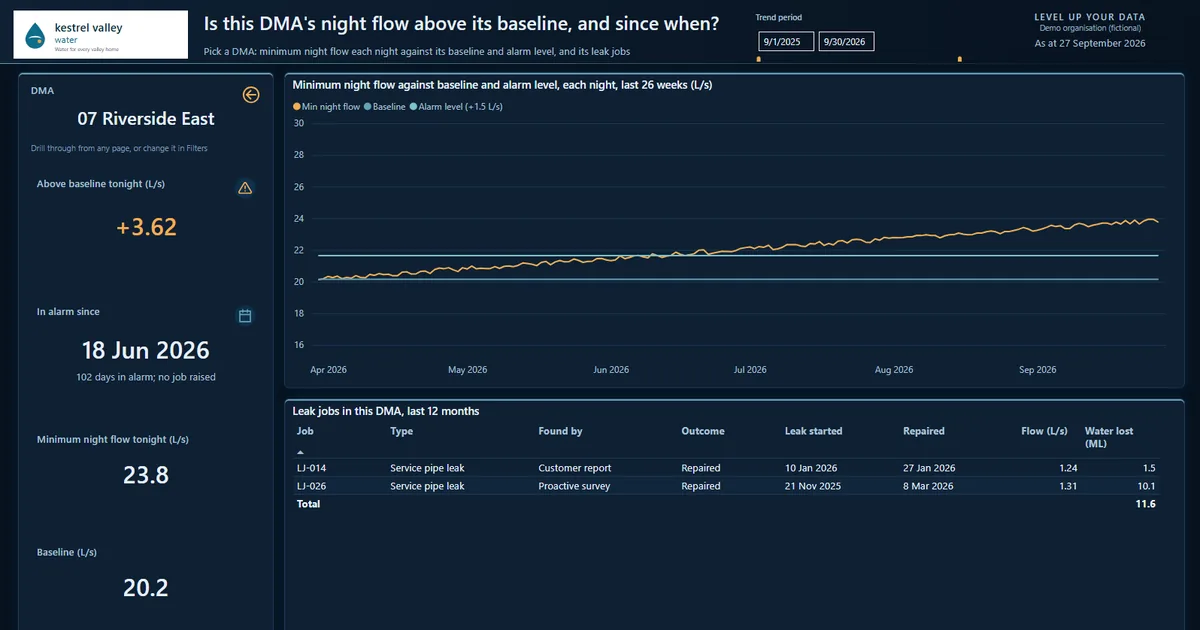
Here’s what that looks like on a Power BI report built for Kestrel Valley Water, a fictional regional utility with 14 DMAs.
Click a screen to see it full size.
Kestrel Valley Water is fictional; figures are illustrative.
Riverside East has been in alarm since 18 June 2026: 102 days, with no job raised. Its night flow is 3.62 L/s above baseline, which is the 0.26 ML a day from the example above. Joining the alarm to the work orders is what makes that visible: the report shows the DMA’s last two leak jobs, both closed months ago, and nothing since.
Three measures close the gap: the DMAs in alarm with no job, how many nights each has been in alarm, and the water lost since the alarm started. Put them in front of whoever owns network operations every week, ranked by water lost, and the conversation moves from “is the data right?” to “which crew goes where?”
Join the alarm to the job and the difference is measurable.
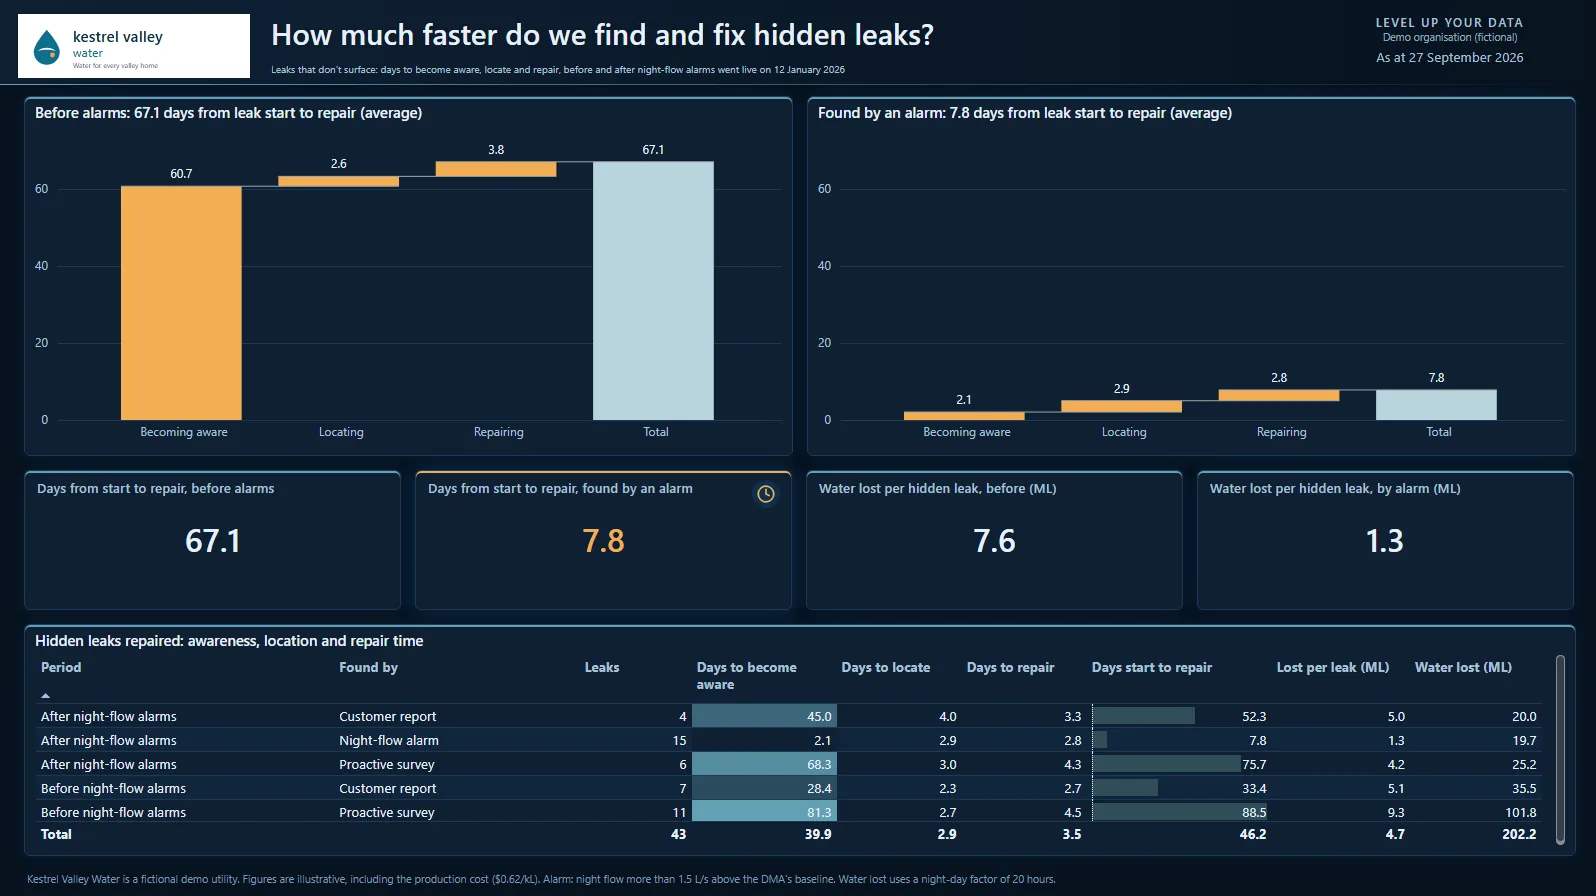
The fictional utility’s night-flow alarms went live on 12 January 2026. Since then, a hidden leak found by an alarm has taken 7.8 days from start to repair, on average, against 67.1 days before. Each one lost 1.3 ML instead of 7.6. Locating and repairing take about the same time either way; the saving is almost entirely in knowing sooner. That’s the kind of question water utility data analytics answers for every DMA, every week.
What data do you need to join?
A night-flow report that someone acts on joins five sources. Three are measurements: DMA inflow from SCADA or data loggers, pressure for the night-day factor and pressure management, and smart meter night consumption where you have it. Those night reads separate genuine night use from leakage. The other two are records: work management for jobs and repairs, and GIS for DMA boundaries and which meters feed each one. Keeping those joined and current is a data architecture job. Once SCADA and work management share a DMA key, “every alarm has a job” becomes a measure you can report, not a hope.
Questions we’re asked
No. Some night use is legitimate: toilets, appliances, and customers who work or produce overnight, such as hospitals or factories on shifts. That’s why alarms compare night flow with each DMA’s own baseline rather than reading it as leakage outright. Smart meter night reads, where you have them, and a list of known large night users help separate genuine use from leaks.
It compares each night’s minimum with the DMA’s own leak-free baseline and treats the excess as new leakage. That excess rate becomes a daily volume through a night-day factor, set below 24 hours because pressure, and so leak flow, peaks at night. Multiply the volume by your production cost for its value, and total it since the alarm began to rank DMAs for crews.
A DMA is a zone of the water network with a defined boundary, valves closed along its edges and meters on every inflow. The meters measure the water entering it, which makes a water balance, night flow and leakage by zone possible. Boundaries change when someone opens a valve for maintenance, so check a DMA’s valves and meters before trusting its alarms.
Not on their own. Customer meters show leaks on the property side, such as a running toilet or a burst garden pipe, as continuous overnight use. Leaks on mains and service pipes before the customer meter never pass through them, so they only show up in the DMA’s inflow. The two work best together: inflow minus customer night use leaves the network’s own leakage.
Long enough to rule out a one-off, such as firefighting or a logger fault, but not so long that the leak runs for weeks. Many teams wait a few consecutive nights, then confirm with the trend before sending a crew. Whatever rule you choose, agree it with network operations, write it down and measure how often it’s met, so slow responses show up in the weekly numbers.
Find your hidden leaks sooner
A fixed-price pilot, 4–6 weeks, scoped with you. Start with a free 30-minute meeting.