
Non-revenue water (NRW) is the water a utility puts into its network but never bills. That covers real losses from leaks and bursts, apparent losses from meter error and unauthorised use, and unbilled authorised use such as mains flushing. You calculate it from an International Water Association (IWA) water balance: system input volume minus billed authorised consumption. It usually appears as a percentage of system input. The infrastructure leakage index (ILI) then compares real losses with the unavoidable level for that network’s mains, connections and pressure. An ILI of 1 means real losses equal the unavoidable level, and 2 is twice it.
Key takeaways
- The International Water Association (IWA) water balance, as Taylor’s 2008 paper sets it out, defines non-revenue water as system input volume minus billed authorised consumption: real losses, apparent losses and unbilled authorised use together.
- An infrastructure leakage index (ILI) divides a network’s current annual real losses by its unavoidable annual real losses, which allow for mains length, connections and pressure, so an ILI of 2 means real losses are twice the unavoidable level (Taylor, 2008).
- Unavoidable annual real losses, in litres a day, are (18 × km of mains + 0.8 × connections + 25 × km of private pipe to the meter) × average pressure in metres, the IWA’s 1999 equation (Lambert, October 2021).
- The Bureau of Meteorology’s NPR indicators and definitions handbook (January 2018) codes real losses per service connection per day as indicator A10 and the ILI as A9 for the National Performance Report, whose 2024–25 edition is the latest (checked September 2026).
Updated October 2026
What is non-revenue water? Start with the water balance
Every leakage measure starts by accounting for all the water you put into the network over a year. The IWA water balance splits that system input volume into water used with permission (authorised consumption) and water that wasn’t (water losses). Non-revenue water is everything you produced but didn’t bill: system input minus billed authorised consumption (IWA water balance and ILI, Taylor, 2008). As a percentage:
NRW % = (system input volume − billed authorised consumption) ÷ system input volume × 100
The IWA water balance, in one table
| System input volume | Component | Counts as |
|---|---|---|
| Authorised consumption | Billed authorised (metered and unmetered) | Revenue water |
| Authorised consumption | Unbilled authorised (flushing, firefighting) | Non-revenue water |
| Water losses | Apparent losses (meter under-registration, unauthorised use, data errors) | Non-revenue water |
| Water losses | Real losses (leakage and bursts on mains and service connections, storage overflows) | Non-revenue water |
The split that matters most is the bottom two rows. Apparent losses are water that reached a customer but wasn’t measured or billed properly: a slow meter, an illegal connection, a billing error. Real losses are water that physically left the pipes before reaching anyone. They need different fixes: meters and data on one side, pressure management and leak repair on the other. So a single NRW figure can’t tell you where to spend.
How is the infrastructure leakage index calculated?
ILI takes the real losses row from the water balance and divides it by the unavoidable level for that network.
The ILI formula
- ILI = CARL ÷ UARL
- CARL (current annual real losses): the real losses from your water balance, usually expressed in litres a day.
- UARL (unavoidable annual real losses), in litres a day = (18 × km of mains + 0.8 × number of connections + 25 × km of private pipe from the property boundary to the meter) × average operating pressure in metres.
Sources: ILI = CARL ÷ UARL, Taylor, 2008; UARL equation (IWA, 1999), Lambert, 2021.
The UARL formula is what makes ILI fair. A network with long mains, many connections and high pressure will always leak more than a compact, low-pressure one. UARL builds that in.
A worked example (illustrative figures). Take a network with 100 km of mains, 5,000 connections and an average pressure of 50 metres. Its meters are at the property boundary, so there is 0 km of private pipe before the meter:
- UARL = (18 × 100 + 0.8 × 5,000 + 25 × 0) × 50 = (1,800 + 4,000) × 50 = 290,000 litres a day, or 290 kL.
- If the water balance shows real losses of 580 kL a day, ILI = 580 ÷ 290 = 2.0.
Leakage is twice the unavoidable level. Bringing it down means finding leaks sooner, repairing them faster, managing pressure and renewing the worst mains. ILI tells you how much room there is.
ILI or litres per connection per day?
Australian utilities report both to the Bureau of Meteorology for the National Performance Report (NPR). The relevant indicators, as the Bureau’s handbook codes them (NPR indicators and definitions handbook, January 2018):
- A8: water main breaks, bursts and leaks per 100 km of mains.
- A9: infrastructure leakage index (a ratio).
- A10: real losses in litres per service connection per day.
Litres per connection per day is the NPR’s main leakage measure (LEAKSSuite Library, Australian ILIs 2022/23). It’s simple to explain to a board, and it compares well within the NPR’s size groups, where utilities have similar networks. ILI adjusts for pressure and network density. That makes it the better measure when you compare districts that look nothing alike, or set yourself against utilities overseas.
In practice, you want both from the same water balance, so they never disagree about the volume lost. The latest national results are on the Bureau of Meteorology’s NPR page (2024–25 report, checked September 2026).
Why does the NRW percentage mislead on its own?
NRW as a percentage of system input is the number most boards see. It has two weaknesses.
It moves with consumption. Leakage doesn’t drop when customers use less. In a wet year, demand falls, system input falls with it, and the same volume of leakage becomes a bigger percentage. The network didn’t get worse; the denominator shrank.
It mixes two problems. A district can have high NRW because its meters under-read, not because its pipes leak. Those losses cost different amounts too. A litre of real loss costs you what it cost to produce. A litre of apparent loss reached a customer, so it costs you the retail tariff. Valuing them separately is the only way to compare a meter replacement program with a leak detection crew.
What does it look like by district metered area?
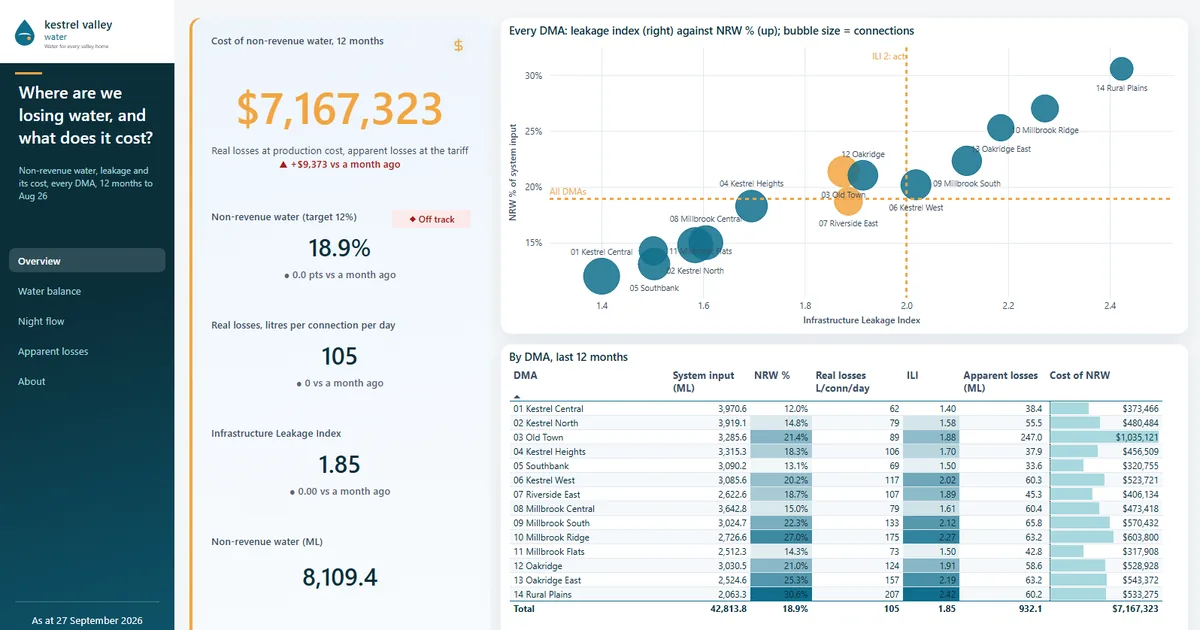
Here’s the chain on a real Power BI report, built for Kestrel Valley Water, a fictional regional utility with 14 district metered areas (DMAs). Across the utility, NRW is 18.9% and the ILI is 1.85, with real losses of 105 litres per connection per day. Real losses at production cost and apparent losses at the tariff together cost AUD 7,167,323 over 12 months.
Click a screen to see it full size.
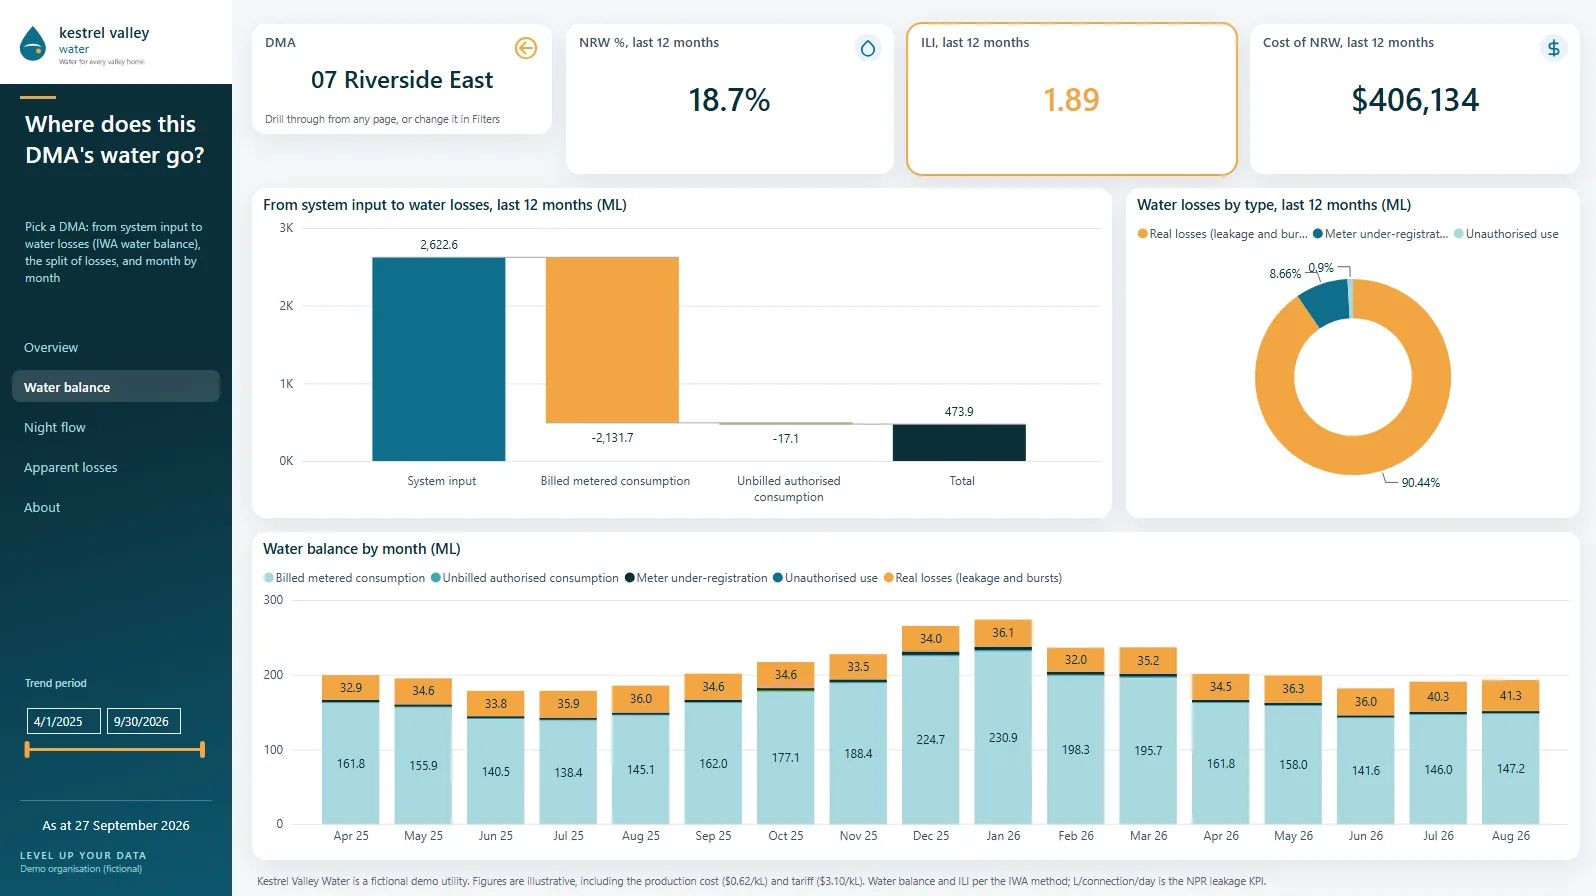
Kestrel Valley Water is fictional, built on typical sector data; figures (including production cost and tariff) are illustrative.
One district, Riverside East, shows the water balance at work: NRW of 18.7%, an ILI of 1.89, and AUD 406,134 a year in lost water. About 90% of the volume lost is leakage. The report values leaks at production cost and apparent losses at the customer tariff, so about a third of that cost is apparent losses. The overview then sets every DMA side by side:
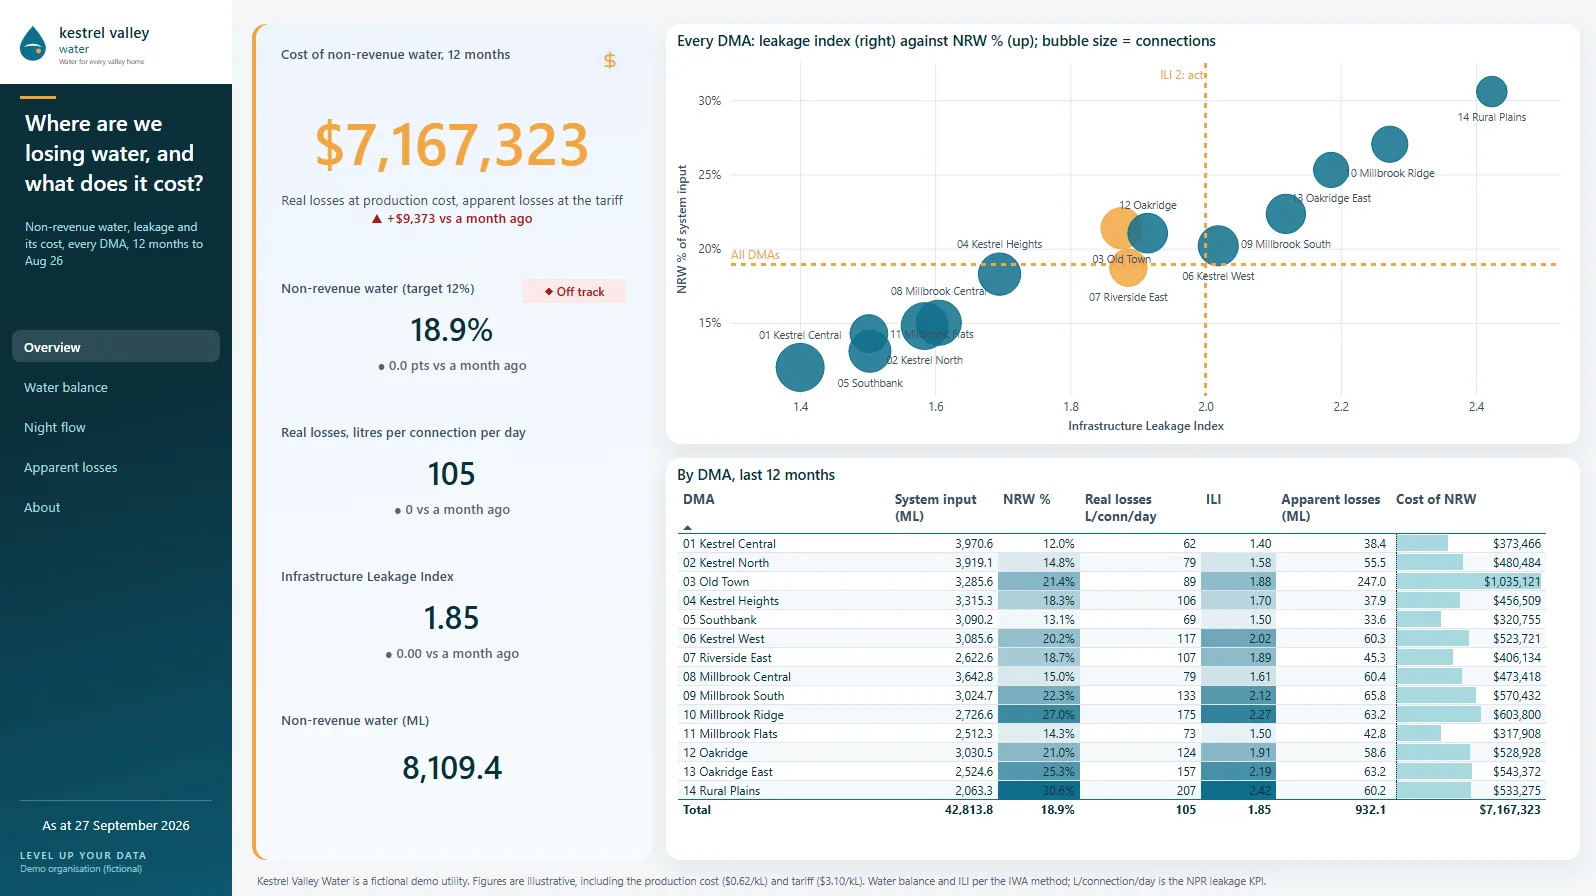
Five DMAs sit above both the utility-wide NRW and an ILI of 2, so they’re where leak detection and pressure work pay back first. Old Town is the useful exception. Its NRW is 21.4%, yet its ILI is 1.88, because a large share of its losses are apparent, from old meters that under-read. Those apparent losses come to 247 ML a year, against 34 to 66 ML in every other DMA. On NRW alone it looks like a leakage problem; the water balance shows a metering one as well. That’s what water utility data analytics is for: the same method, every DMA, every month, instead of one figure a year.
What data do you need?
An ILI by DMA joins systems that rarely talk to each other:
- Bulk and DMA inflow meters from SCADA or the historian, for system input.
- Billed consumption from the billing or customer information system, aligned to calendar months.
- Unbilled authorised use: mains flushing and firefighting estimates, usually from operations records.
- Mains length and connections by DMA from GIS and the asset register.
- Average pressure from pressure loggers or the hydraulic model.
Getting these into one model, reconciled every month, is a data architecture job before it’s a reporting one. Once the components add up to system input for every DMA, ILI and litres per connection per day fall out of the same numbers.
Questions we’re asked
It’s water a utility produces but doesn’t bill. Older American sources often call it unaccounted-for water. The IWA term is broader, because it also counts authorised use nobody pays for, such as firefighting. It matters for money as well as conservation. A leaked litre costs what it took to treat and pump, and an under-metered litre costs the retail price the customer never paid.
Take a year’s system input volume and subtract billed authorised consumption, metered and unmetered. The result is non-revenue water in megalitres. Divide it by system input and multiply by 100 for the percentage. With illustrative figures, 10,000 ML in and 8,200 ML billed leaves 1,800 ML, or 18%. Use the same 12 months for both volumes, or billing lags distort the result.
Closer to 1 is better, but there’s no single pass mark. An ILI below 1 is possible but rare, and often points to an error in the water balance (Taylor, 2008). The right target depends on what water costs to produce, what leak detection and repairs cost, and how old the mains are. Track the trend by DMA so a worsening district doesn’t hide behind a good average.
Real losses are only the water that physically escapes from mains, service connections and storages. Non-revenue water is broader. It adds apparent losses (meters that under-read, unauthorised use, data errors) and authorised use you don’t bill, such as mains flushing and firefighting. A utility can cut non-revenue water by fixing meters and billing without repairing a single leak.
Through the National Performance Report, which the Bureau of Meteorology publishes every year with each reporting utility’s indicators available to download. It groups utilities by connected properties (10,000–20,000, 20,000–50,000, 50,000–100,000 and 100,000+). So the fair comparison is with the median and top quartile of your own size group, not the national average.
See your own water balance by DMA
A fixed-price pilot, 4–6 weeks, scoped with you. Start with a free 30-minute meeting.