
Aged care occupancy rates in Australia are at their highest in nine years: 93.12% nationally in May 2026 (Mirus Australia, reported by Inside Ageing in June 2026), and 95.2% across the homes in StewartBrown’s survey for the nine months to March 2026. An aged care occupancy rate is the share of available bed-days that residents occupied in a period. Yet 62% of those surveyed homes made an operating loss, StewartBrown’s March 2026 survey found.
Key takeaways
- Australia’s national aged care occupancy rate was 93.12% in May 2026, the highest since May 2017 and the fourth monthly rise in a row (Mirus Australia, Industry Analysis, June 2026, reported by Inside Ageing, 9 June 2026).
- StewartBrown’s March 2026 survey of 1,173 residential aged care homes put average occupancy at 95.2% for the nine months to 31 March 2026, up from 94.2% a year earlier (reported by Inside Ageing, 21 July 2026).
- In the same StewartBrown survey (March 2026), 62% of homes made an operating loss, up from 49% a year earlier, and the average result was a loss of AUD 9.16 per bed per day (reported by Inside Ageing, 21 July 2026).
- Each empty bed-day loses the resident’s AN-ACC care funding, priced at AUD 303.19 per national weighted activity unit, and the AUD 22.15 daily hotelling supplement, both from 1 October 2026 (Department of Health, Disability and Ageing, Residential Aged Care funding update, 2 September 2026).
Updated October 2026
High occupancy no longer guarantees a margin, so every empty bed-day matters. Each one loses that day’s care funding, the hotelling supplement and the resident’s fees, while the roster and the building cost the same. The fix is to measure occupancy home by home, every week, rather than as one monthly group number.
This post explains why the two national figures differ and what an empty bed-day is made of. It then shows how to calculate your own revenue at risk, and what a healthy group average can hide.
What are aged care occupancy rates in Australia today?
Both of this year’s headline numbers are right. They measure different things.
- 93.12%, May 2026: Mirus Australia’s national figure, from its monthly Industry Analysis. It was the fourth monthly rise in a row and the highest since May 2017 (Inside Ageing, 9 June 2026).
- 95.2%, nine months to 31 March 2026: StewartBrown’s survey of 1,173 homes with almost 96,000 beds, up from 94.2% a year earlier (StewartBrown, March 2026 survey).
The two figures come from different sets of homes, and a home can count occupancy against every approved place or only the beds in operation. The gap between the two figures, two points, is larger than most homes move in a month. So before your board compares its own figure with either, check which beds your board pack counts: all places, operational beds, or operational beds less those offline for refurbishment.
Why do high occupancy and losses arrive together?
In StewartBrown’s survey, 62% of homes made an operating loss in the nine months to March 2026, up from 49% a year earlier. The average result was a loss of AUD 9.16 per bed per day. Direct care revenue rose 6.6%, while direct care costs rose almost 11.7% as providers worked towards care minutes targets and absorbed award wage increases (Inside Ageing, 21 July 2026).
Most of those costs are set for the month. You roster a wing for the wing, not for the number of residents in it on a given night. Revenue works the other way: a home earns it bed by bed, day by day. That makes occupancy the lever a provider can move fastest. A bed filled a week sooner shows up in this month’s result; most cost programs take a quarter or more.
What does an empty bed-day cost under AN-ACC funding?
When a bed stands empty for a day, the home goes without:
- Care funding. AN-ACC funds residential care. From 1 October 2026 the AN-ACC price, which sets each resident’s care funding, is AUD 303.19 per national weighted activity unit. What a resident brings depends on their AN-ACC class (Department of Health, Disability and Ageing, funding update; IHACPA pricing advice 2026–27, August 2026).
- The hotelling supplement, AUD 22.15 per resident per day, unchanged from 1 October 2026 under the same funding update.
- The resident’s own payments: the basic daily fee and, where it applies, the daily accommodation payment for the room.
What stays: the rostered staff, the kitchen and laundry, the building, insurance, and the admissions effort to fill the bed. Most of the lost revenue comes straight off the margin.
The cost also grows with time. A bed empty for 60 days costs twice what a 30-day vacancy does, so the longest vacancies deserve attention first. The time a home takes to fill a bed matters as much as how many beds fall empty.
There’s no honest single figure for the sector, because the answer depends on your residents’ classes, your fees and your room prices. The table below shows how to work out your own.
How to calculate residential aged care occupancy and revenue at risk
Six measures, defined so finance, residential managers and the board read them the same way.
| Measure | How to calculate it | Why it matters |
|---|---|---|
| Occupancy rate | Occupied bed-days ÷ available bed-days (operational beds minus beds offline) | The base your board compares; say which beds you count |
| Vacant bed-days | Available bed-days − occupied bed-days | The volume of lost revenue |
| Revenue per occupied bed-day | Care funding + supplements + resident fees and accommodation revenue ÷ occupied bed-days | What a filled bed earns at your home, with your resident mix |
| Revenue at risk | Vacant bed-days × revenue per occupied bed-day | The cost of the empty beds, this month and financial year to date |
| Days to fill a vacancy | Average days a bed stood empty, for vacancies filled in the last 90 days | How fast admissions recover a departure |
| Long vacancies | Beds empty 31 days or more, and their share of current vacancies | Where admissions effort should go first |
Two choices make or break these numbers. Decide once whether offline beds count as available, and print the rule on the page. And work out revenue per occupied bed-day for each home from its own residents, not one group rate. A memory support bed and a shared room don’t earn the same.
What does occupancy look like home by home?
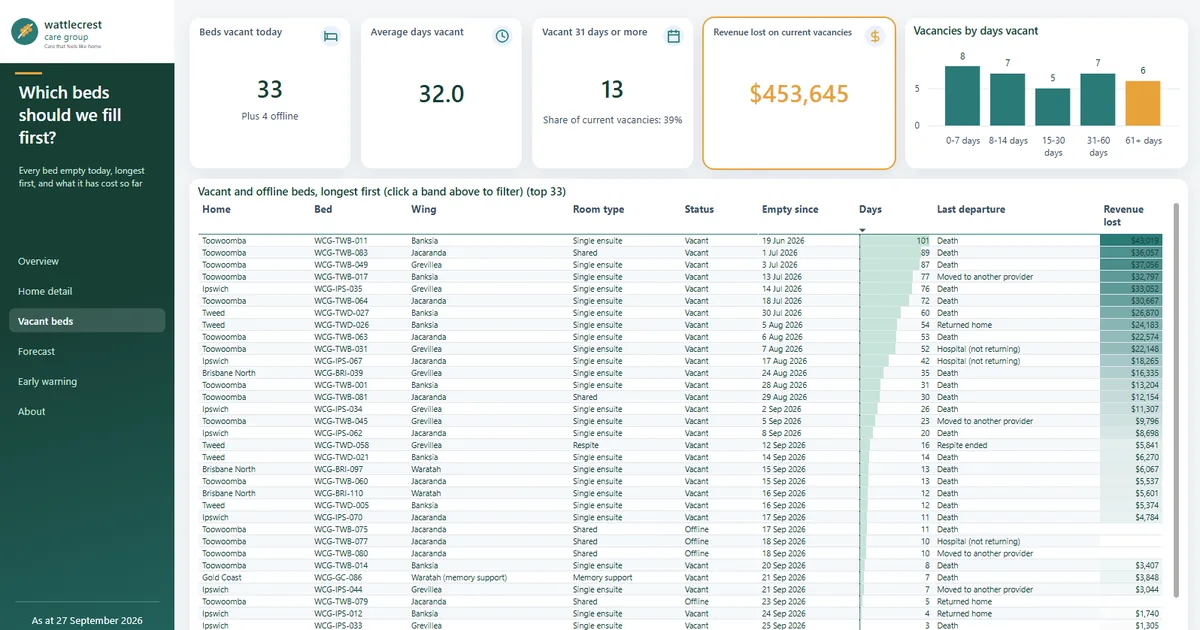
The screens below come from our aged care analytics reports, built on Wattlecrest Care Group, a fictional provider with six homes. The Vacant beds page answers one question: which beds should we fill first? It lists every empty bed, the longest first, with the revenue it has lost so far.
Click a screen to see it full size.
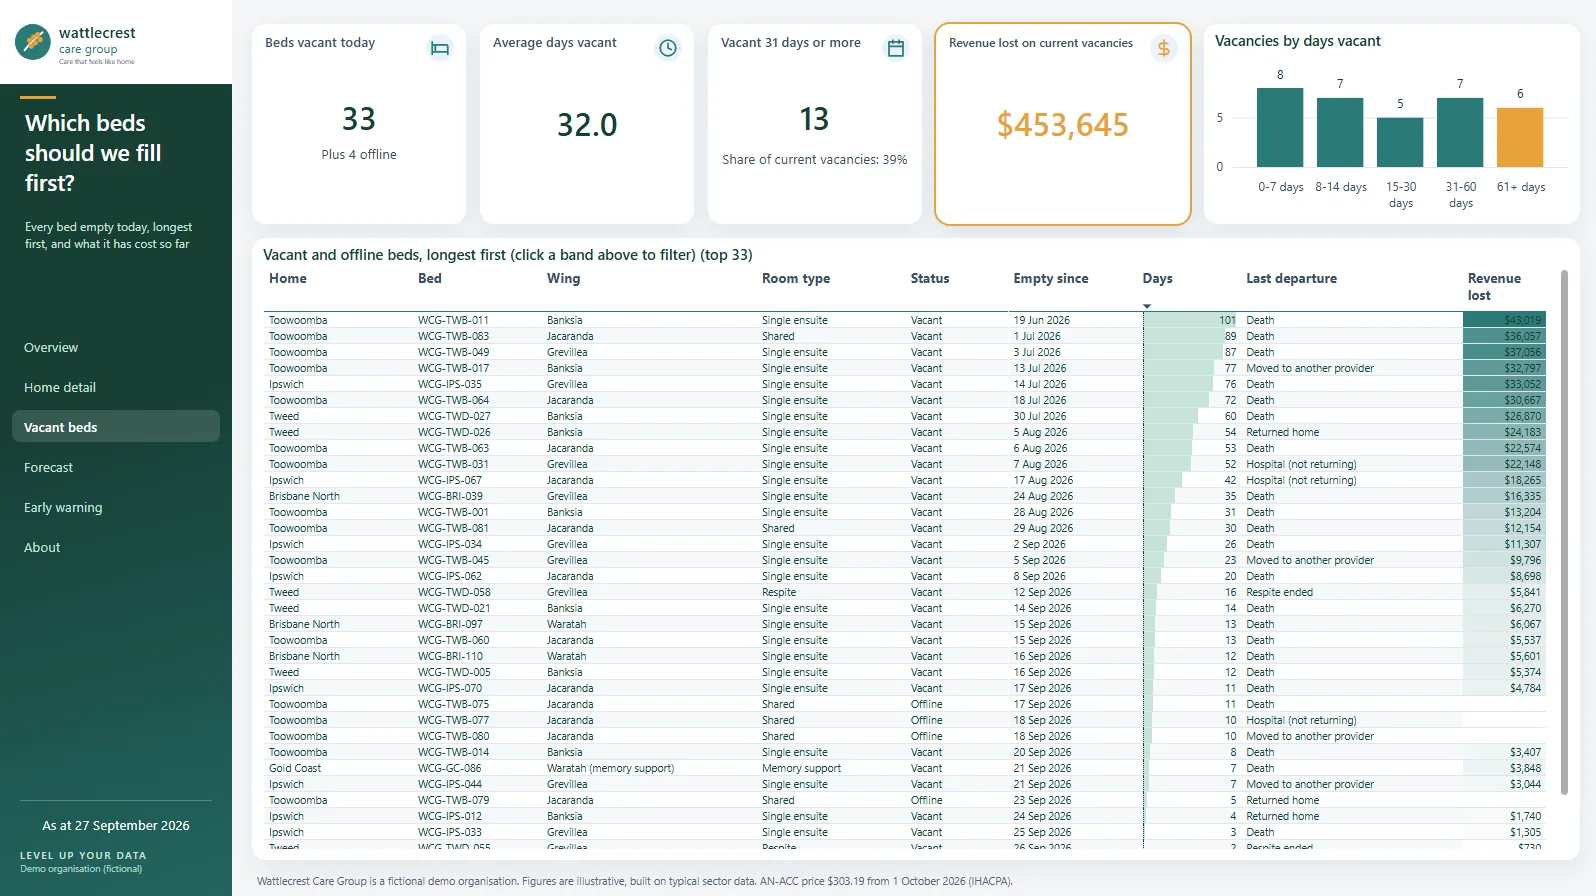
Wattlecrest Care Group is fictional, built on typical sector data; figures are illustrative.
On 27 September 2026, 33 beds were vacant, with 4 more offline. Thirteen had been empty for 31 days or more, 39% of current vacancies, and the current vacancies had already cost AUD 453,645. The three longest are all at Toowoomba: 101, 89 and 87 days.
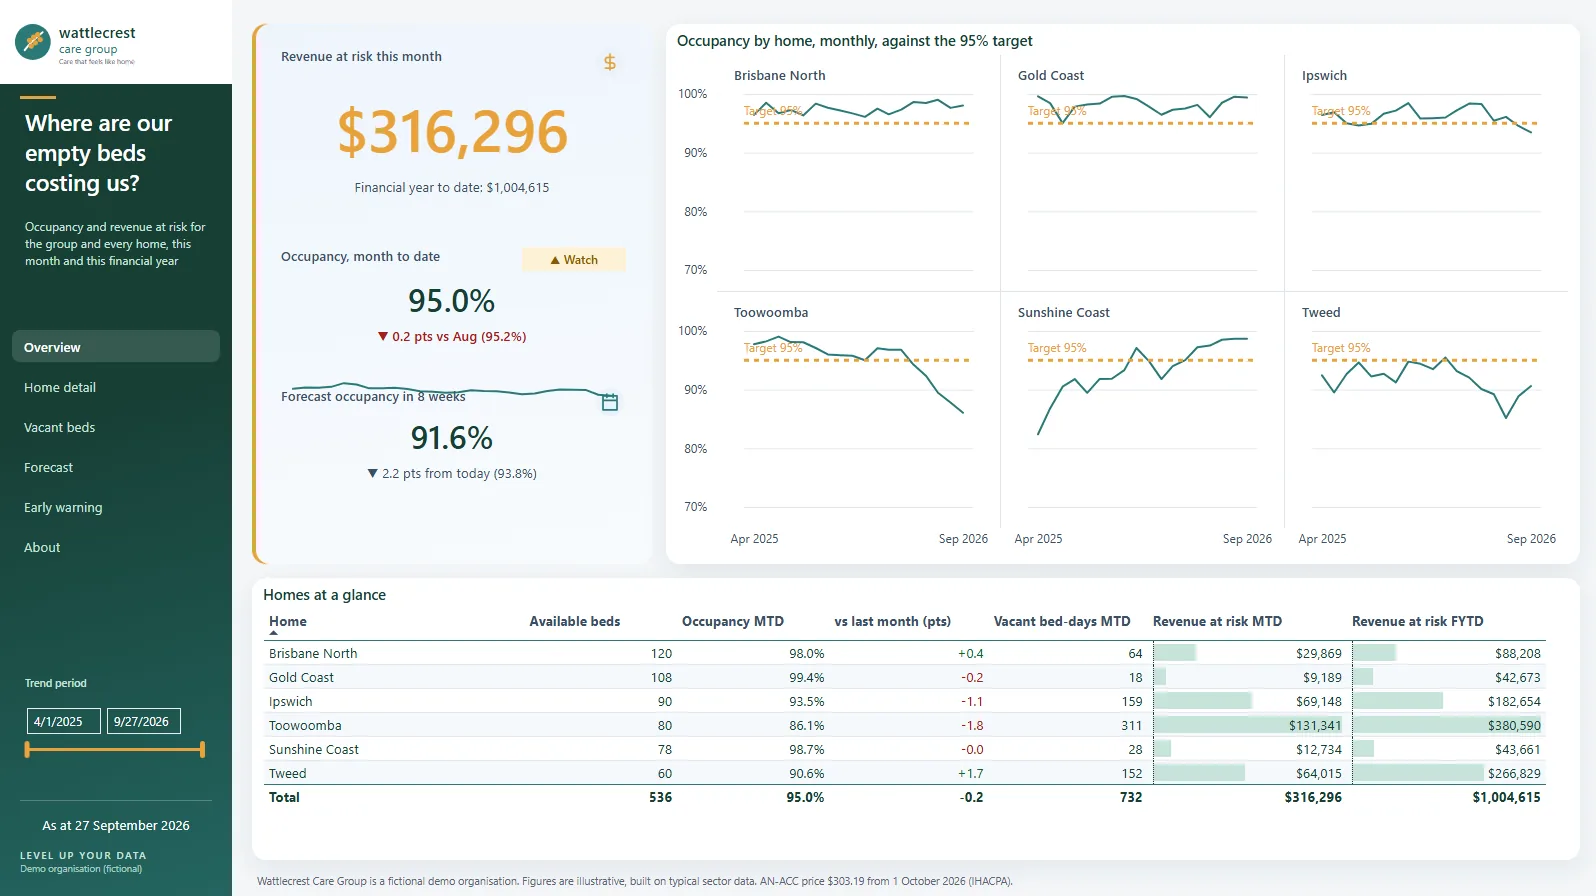
The overview shows why that matters. The group reads 95.0% for the month to date, right on its 95% target. Toowoomba reads 86.1%. It carries AUD 380,590 of the group’s AUD 1,004,615 revenue at risk this financial year: more than a third, from one home of six. A monthly group figure would have called this month on target. The same page projects group occupancy at 91.6% in eight weeks, 2.2 points below today’s census: the slide isn’t over.
Which occupancy signals should you watch every week?
- Beds vacant 31 days or more. A long vacancy often has a specific cause: a room that’s hard to place, a wing waiting on maintenance, a referral source that has gone quiet. Give each one an owner and a date.
- Days to fill a vacancy. If it lengthens, admissions has slowed, and you’ll see it here weeks before occupancy falls far enough to notice.
- Each home’s weekly trend against the target. Compare the last four weeks with the last 13. A slow slide shows up as a warning while there’s still time to act, not as a red number in next month’s board pack.
Put the three on one page and review them in the same weekly meeting as admissions. The conversation moves from “why did last month drop?” to “which three beds are we filling this week, and who’s on it?”
None of this needs new systems. The census sits in your care management system, departures and enquiries in your admissions tracker or CRM, and funding in your finance system and government statements. Joining them reliably, and reconciling the result to your management accounts, is the core of our data analytics consulting.
Questions we’re asked
It depends on whose figure you read. Mirus Australia puts national occupancy at 93.12% for May 2026, while the homes in StewartBrown’s March 2026 financial survey averaged 95.2%. Residential aged care occupancy, sometimes called nursing home occupancy, is near a nine-year high. StewartBrown expects demand to keep occupancy above 96 per cent for the next five to ten years as the population ages. So average occupancy alone won’t separate a strong home from a struggling one.
Divide the bed-days residents occupied in the period by the bed-days available, and multiply by 100. Available bed-days are the beds in operation times the days in the period, less any beds offline, if that is your rule. Write the rule down, because surveys and the national figure count beds differently, and compare each home with its own target week by week.
No sector-wide dollar figure is reliable, because funding follows each resident’s classification, and fees and room prices vary by home. Take a home’s revenue for the month, divide it by the bed-days residents occupied, and you have its own daily value of a filled bed. Multiply by the empty bed-days to see the month’s cost, and repeat for each home.
Costs are growing faster than funding. Direct care is the clearest case. StewartBrown’s March 2026 survey found the average direct care margin shrank from AUD 18.46 to AUD 5.91 per bed per day in a year. It shrank as homes added care minutes and paid higher award wages. Full homes still lose money when each resident costs more to care for than the funding brings in.
See every empty bed, every week
A fixed-price pilot, 4–6 weeks, scoped with you. Start with a free 30-minute meeting.