
Finance, HR, marketing and sales analytics
Finance, HR, marketing and sales
Management reporting for finance, HR, marketing and sales: twelve Power BI reports you can open now
Management reporting is how a leadership team runs the business: profit and cash against budget, hiring against plan, campaigns against pipeline, bookings against quota. See twelve Power BI reports on one fictional business, three for each function, then click through them live.
7.2%
of employed Australians, just over 1.0 million people, changed employer in the year to February 2026, down from 7.7% the year before. Source: ABS, 31 July 2026
45%
of recruiting employers found it hard to fill vacancies in August 2026, and 59% were hiring only to replace people who had left. Source: Jobs and Skills Australia, August 2026
27.4 days
the national average time to pay a small business invoice. Source: Treasury, 11 February 2026
55 days
the all-industry average 95th percentile payment time for July to December 2025; 69.8% of invoices were paid within 30 days. Source: Payment Times Reporting Regulator, August 2026
Facts as at October 2026.
Report examples
Twelve reports on one fictional business
Merrowby Group is a fictional company built on typical business data: it sells and services commercial kitchen and refrigeration equipment in Australia and New Zealand, about AUD 440 million of revenue a year, about 1,150 people in five regions, 420 of them field technicians. Every report runs on the same data, so one problem shows up in all four functions: technicians leaving in QLD and WA become agency labour in the HR reports, then the line 53.7% over budget in the management accounts. Figures are illustrative.
Or click a screen below to see it full size.
Finance
Finance dashboards: are we on budget, and where is the cash?
Equipment margin is eroding on freight, debtor days are rising, and operating costs run over budget on agency labour.
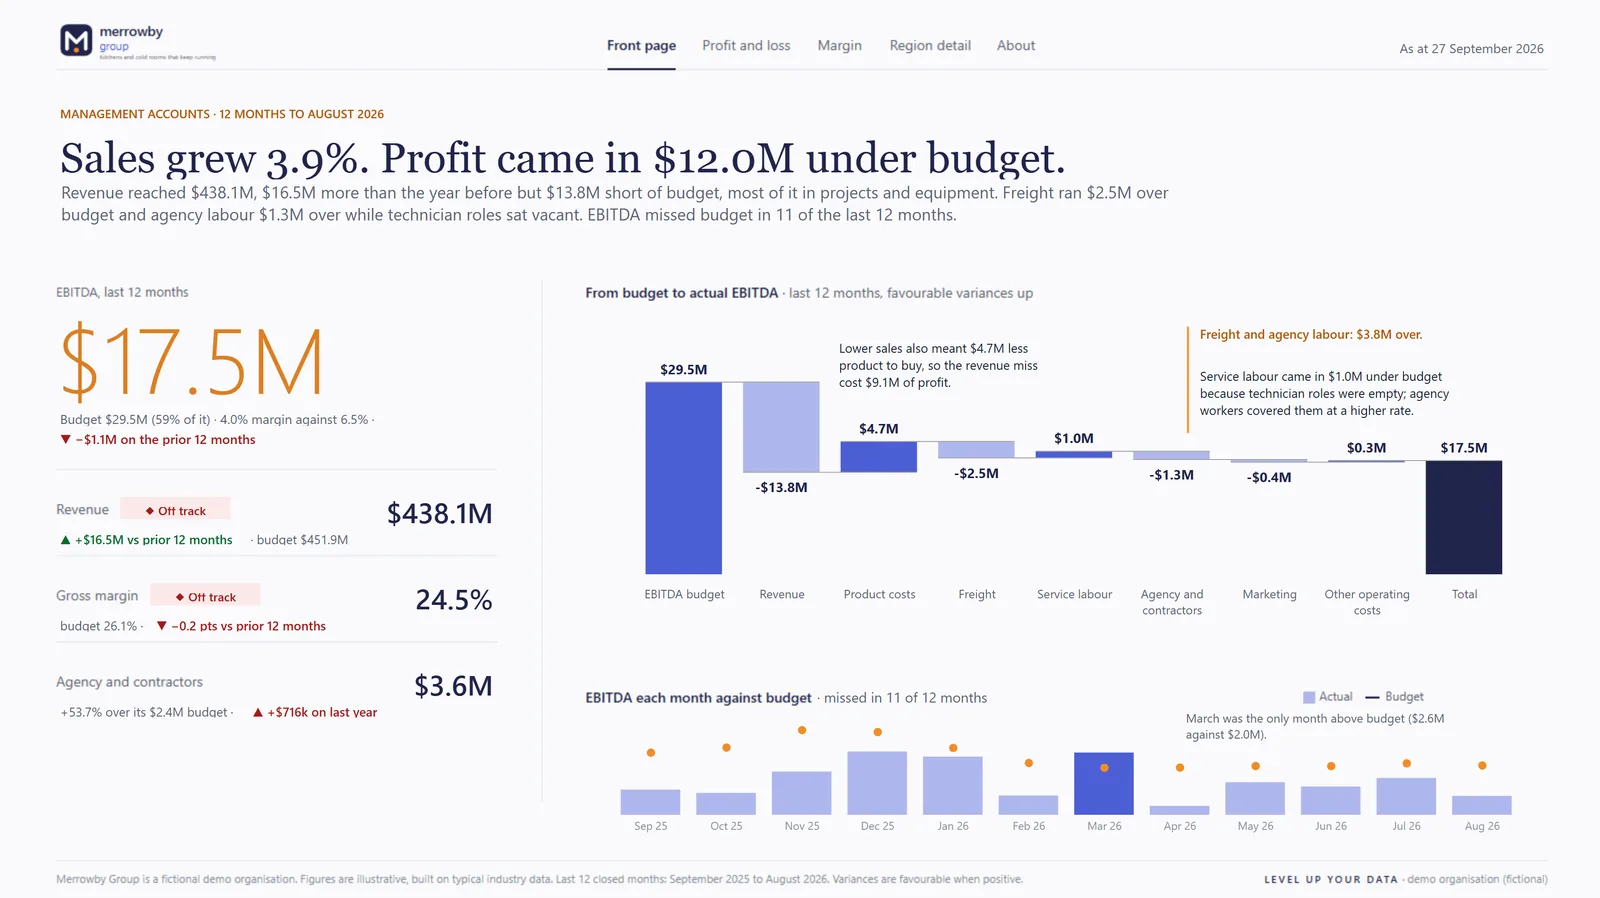
Management accounts
CFO: are we making the profit we budgeted, and where not? Profit and loss against budget and last year, an EBITDA bridge that names the lines, and margin by region.
Cash and working capital
CFO: how much cash is tied up, and who is paying late? Debtor days are 48.4 against a 45-day target and 41.8% of debtors are overdue. Government customers take 83.5 days to pay, healthcare 73.4.
Spend and suppliers
CFO and procurement: where does the money go, and to whom? AUD 301.5 million of supplier spend, 87.8% with a purchase order and 77.4% under contract. Agency labour has a purchase order 28% of the time.
HR
HR dashboards: are we keeping the people we need, and what does losing them cost?
First-year technician turnover is high in QLD and WA, hiring takes longer each year, and overtime, agency workers and untaken leave cover the gap.
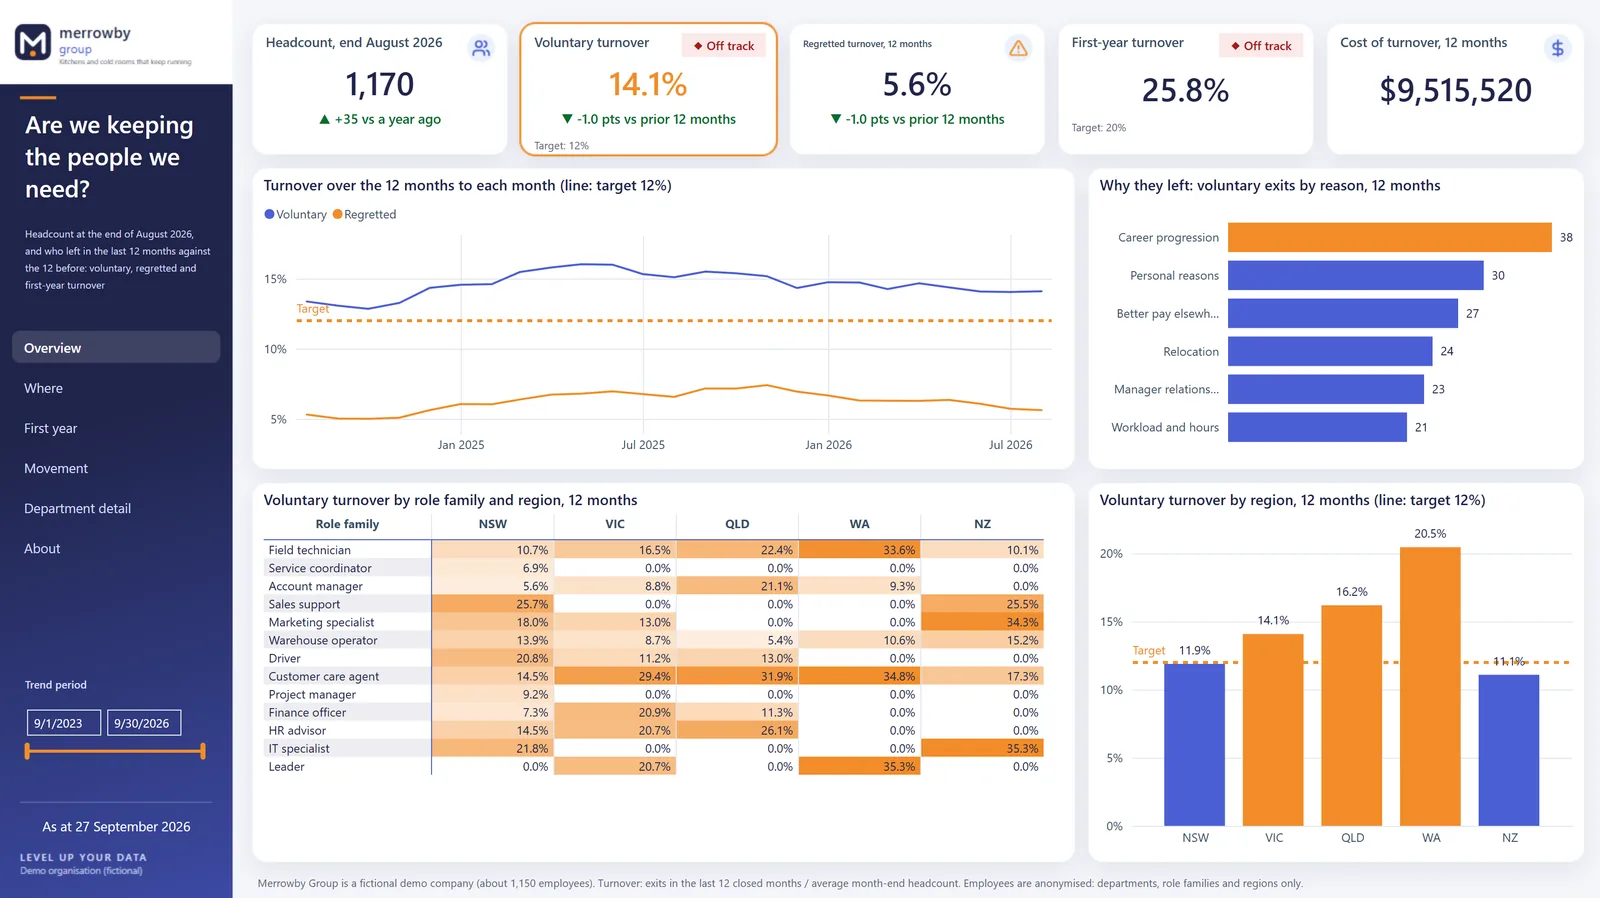
Workforce and turnover
People leader: who is leaving, from where, and why? Turnover as ISO 30414 defines it (voluntary, regretted, first-year), by region, role family and reason, joined to the cost of replacing each leaver.
Recruitment funnel
Head of Talent: how long does hiring take, and where do candidates drop out? The median role takes 38.5 days to fill; offer acceptance is 75.7% against 85%. Agency hires cost AUD 16,767 each and 38.1% leave within a year, against 14.9% of referrals.
Absence, overtime and leave
People leader and CFO: what are absence, overtime and leave balances costing? Unplanned absence is 3.9% against 3%, agency labour cost AUD 3.6 million in 12 months, and 90 people carry more than eight weeks’ leave.
The HR reports show departments, role families and regions, never a named employee or their pay.
Marketing
Marketing dashboards: which channels bring pipeline, and which only bring leads?
Paid social brings cheap leads that rarely convert, partner referrals and trade events bring the pipeline, and a qualified lead that waits a day for a call is rarely accepted.
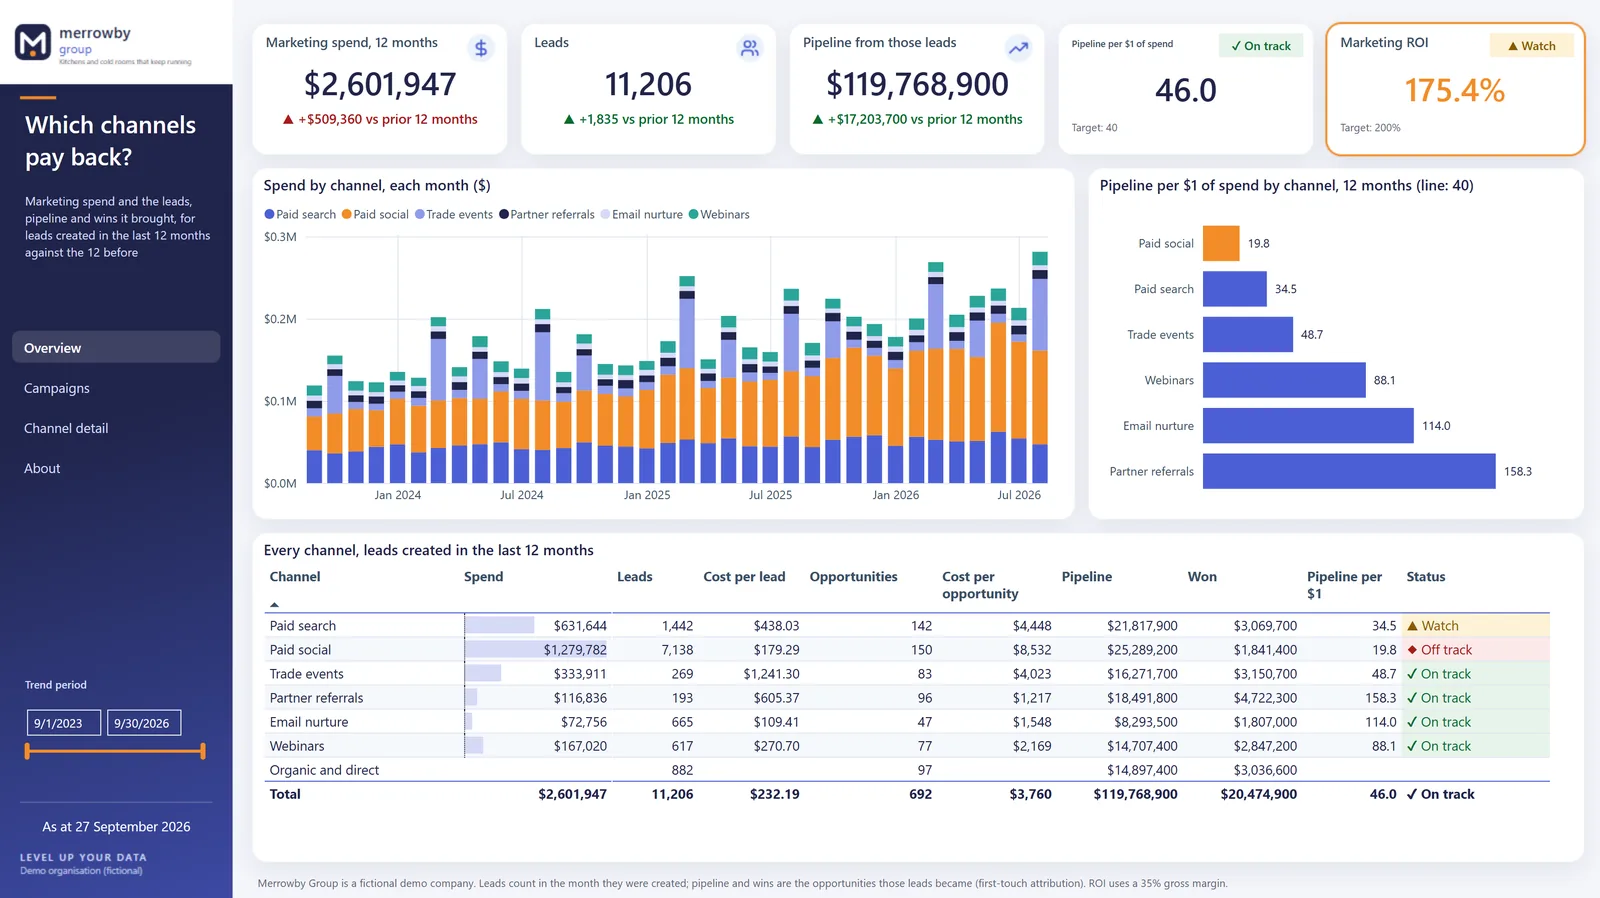
Campaign performance
Marketing Director: which campaigns return their spend? Spend joined to the pipeline and revenue it created, by channel and campaign, against a target of AUD 40 of pipeline per dollar.
Lead funnel and speed to lead
Marketing and sales: how fast do we follow up, and what converts? Sales accepted 22.6% of 3,564 qualified leads (target 25%); the median lead waited 8.7 hours for a call. Leads called within the hour were accepted 28.8% of the time, after a day 11.0%.
Channel mix and acquisition cost
Marketing Director and CFO: what does each channel cost per customer? 220 new customers at AUD 56,988 each, paid back in 10.9 months of margin. Paid social took 49.2% of the media budget and won 8 of them.
Sales
Sales dashboards: will we make the quarter, and will our customers stay?
Next quarter’s pipeline is thin, deals sit past their close dates, hospitality is losing on price, and healthcare contracts are lapsing.
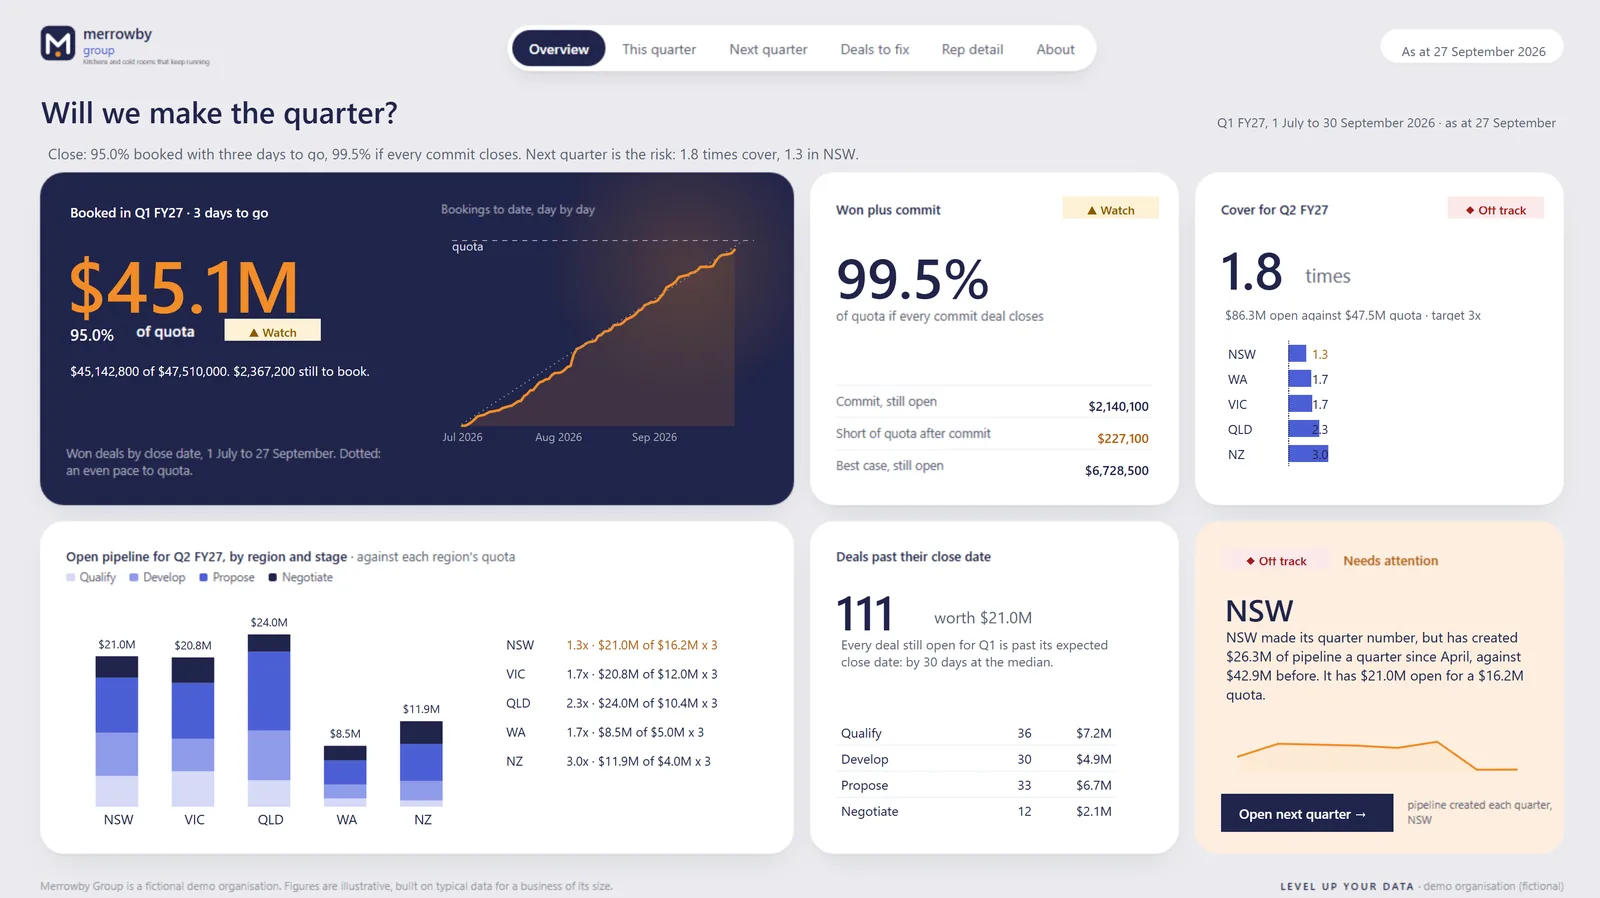
Pipeline and forecast
Sales Director: will we make the quarter? Quota and bookings day by day, the committed and best-case forecast, pipeline cover for next quarter by region, and the 111 deals past their close date.
Sales performance
Sales Director: who is hitting quota, and where are deals won and lost? AUD 168.8 million booked over four quarters, 88.8% of quota. The win rate held at 37.0%, but in hospitality it is 31.5% and 35% of its losses were on price.
Customer revenue and retention
CEO and sales: which customers are at risk of not renewing? Service contract revenue is AUD 21.8 million, but gross revenue retention is 86.1% against 90%. Healthcare and government keep about 70%, and AUD 5.24 million renews in the next 90 days.
The problem
Why do four functions report four versions of the truth?
Each function reports from its own system, in its own words, and management reporting becomes four answers to one question.
Finance
The month-end pack is a spreadsheet rebuilt every month. It says the business is off budget, not which lines, in which region, or why.
HR
Turnover is quoted four ways by four people, and nobody can say what it costs. Payroll knows absence and overtime, finance knows the agency invoices, and no one adds them up.
Marketing
Marketing reports leads and clicks, finance sees the invoices, and nobody can say which channel brings pipeline for the money.
Sales
The forecast is a spreadsheet of reps’ opinions, and pipeline cover is quoted without saying against what.
The CEO wants one version of the numbers: people cost against revenue, marketing against pipeline, sales against cash.
Governance
Numbers your executive team can trust
The reports connect to the systems you already run: the ERP or accounting system (Dynamics 365, NetSuite, SAP, Xero, MYOB, TechnologyOne), the HRIS, payroll and applicant tracking (Workday, SuccessFactors, Employment Hero, ELMO, Dayforce), the CRM (Salesforce, Dynamics 365 Sales, HubSpot), marketing automation and the ad platforms, and the budget and quota spreadsheets. Data in spreadsheets? We start from the spreadsheets.
- Every figure has an owner: the CFO for the ledger and budget, the Chief People Officer for people data, the Sales Director for the pipeline, the Marketing Director for channels.
- Definitions experts accept, printed on the report: turnover, time to fill and absence as ISO 30414 defines them; win rate by count and by value; EBITDA statutory or underlying.
- Reconciled, not assumed: the ledger to the trial balance before a report is released, headcount to payroll, bookings to the invoices in your ERP.
- Private by design: no named employees or individual pay anywhere, and row-level security so a regional manager sees their own region.
- One model, four functions: one set of dimensions (customers, employees, regions, dates) under every report, so the agency labour in the HR report is the number in the management accounts.
Read more about our approach to data governance.
The pilot
How does a management reporting pilot work?
A fixed-price pilot, 4–6 weeks, scoped with you in a free 30-minute meeting: one question, answered on your own data and reconciled to your own figures.
Most pilots start with the report the sponsor is asked about most. For a CFO that is the management accounts; for a Chief People Officer, workforce and turnover; for a Sales Director, pipeline and forecast; for a Marketing Director, campaign performance. The report is tuned with whoever owns the question, and our tested delivery accelerators keep it short. The week-by-week plan is on our services page:
FAQ
Questions leaders ask
Financial reporting is the statutory accounts prepared for people outside the business, on closed periods and accounting standards. Management reporting is for running it: results against budget and target, by region, by product, by team, every month and week, across every function. The management accounts here show only closed periods, with every account mapped to one report line, so the two agree.
No. Merrowby Group is fictional, built on typical business data, and every figure in the twelve reports is illustrative. The facts at the top of this page, on job mobility, recruitment difficulty and payment times, are sourced and dated. A pilot runs the same reports on your data and reconciles them to the figures you already report.
Each system reports on what it holds, and a leadership team’s questions cross systems. Agency labour sits in payroll and supplier invoices, its budget line in the ERP. Leads sit in marketing automation, pipeline in the CRM, revenue in the ERP. Power BI joins them in one model with one customer list, one employee list and one calendar, so the four functions quote the same number.
Every measure follows the function’s accepted definition, printed on the report or its About page. The people measures follow ISO 30414: voluntary exits over average headcount, time to fill from requisition opened to offer accepted. Win rate is shown by count and by value. Whether EBITDA is statutory or underlying, and whether the budget is the original or the reforecast, is agreed with you in week one.
Yes. A pilot is one question on your data, fixed price, 4–6 weeks. The model is built from the start on the dimensions every function shares (customers, employees, regions, dates). When HR, marketing or sales join later, the finance report stays as it is and the new reports use the same regions and periods.
Related
One version of the numbers, across finance, HR, marketing and sales
A fixed-price pilot on your data in 4–6 weeks, starting with a 30-minute meeting.