
Water utility analytics
Water utility analytics
Water utility data analytics: find the water you’re losing, and what it costs
For utilities whose board sees non-revenue water once a year: Power BI reports that join your SCADA, billing, meter and asset data to show every district metered area (DMA), every week.
143
indicators reported by about 300 water entities in the National Performance Report 2024–25: a public benchmark, ready to set beside your own numbers. Source: Bureau of Meteorology, NPR 2024–25
4
size groups by connected properties, from 10,000–20,000 to 100,000+, so the fair comparison is with utilities your size. Source: Bureau of Meteorology, NPR introduction
L/conn/day
litres per connection per day, the national report’s main leakage measure, with the Infrastructure Leakage Index beside it. Source: LEAKSSuite Library, Australian ILIs
2 am to 4 am
the minimum night flow window, when flow into a DMA is mostly leakage, so a rising night flow is the first sign of a new leak. Source: IWA water balance and ILI, Taylor
Sector facts as at September 2026.
Report examples
Seven Power BI reports on one fictional water utility
Kestrel Valley Water is a fictional regional water and sewerage utility: about 180,000 connections across three towns, 14 DMAs and 2,400 km of mains. All seven reports run on it, so the stories join up: Riverside East’s hidden leak, Old Town’s under-reading meters, spike bills that come before hardship, and mains breaks near the bottom of its size group. Good water utility data analytics follows one problem from the board scorecard down to a DMA’s night flow.
Click a screen to see it full size.
Board pack
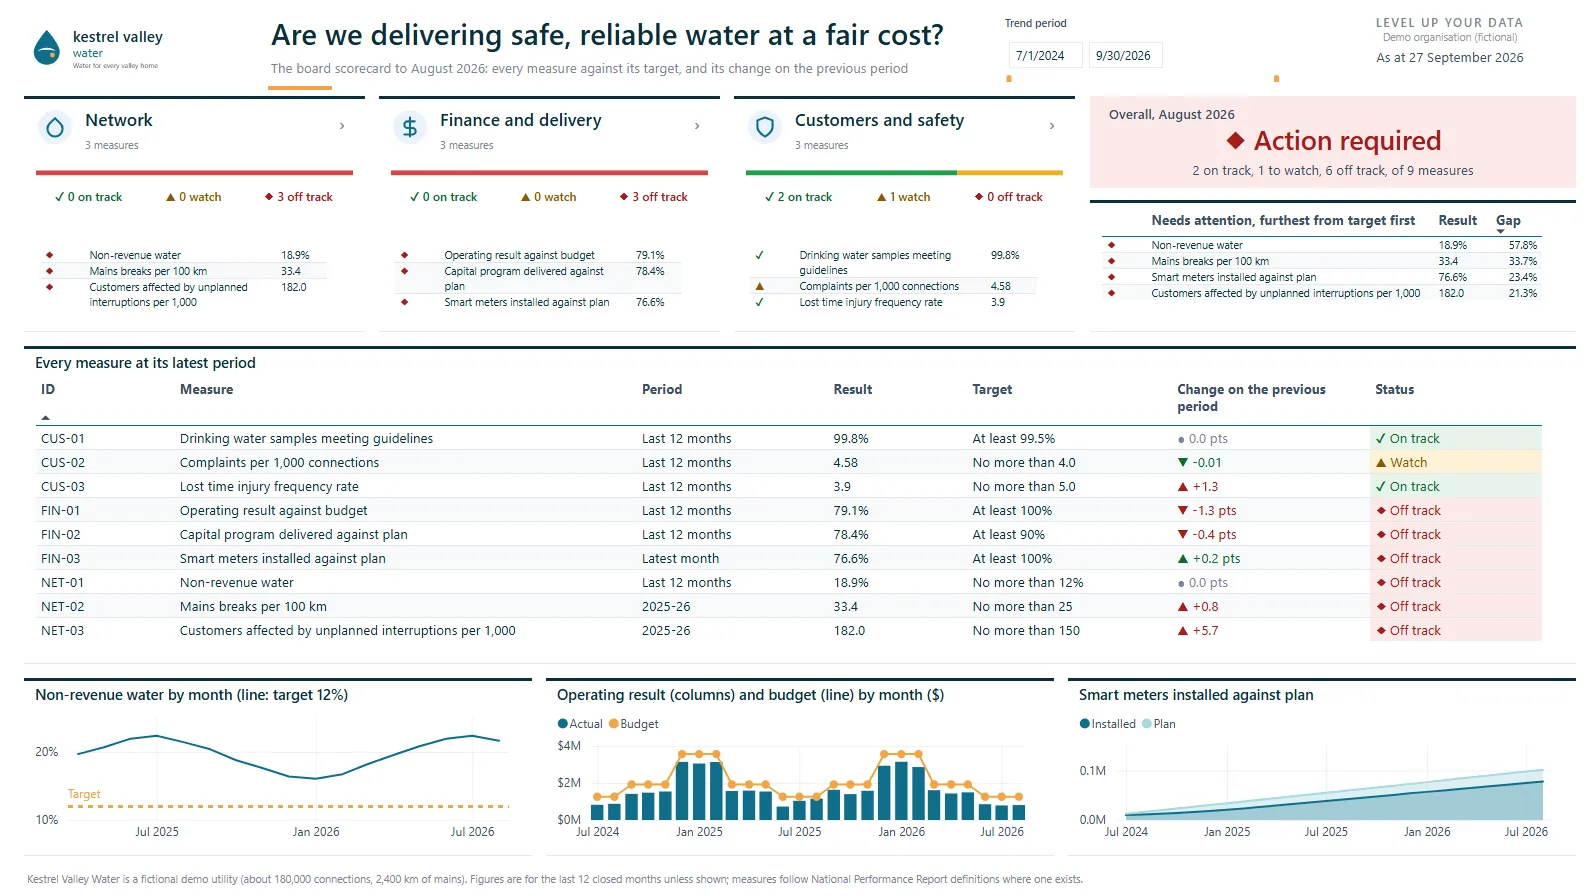
Board: Are we delivering safe, reliable water at a fair cost? Nine measures across network, finance and delivery, and customers and safety, each against its target, with the gaps furthest from target listed first.
Non-revenue water
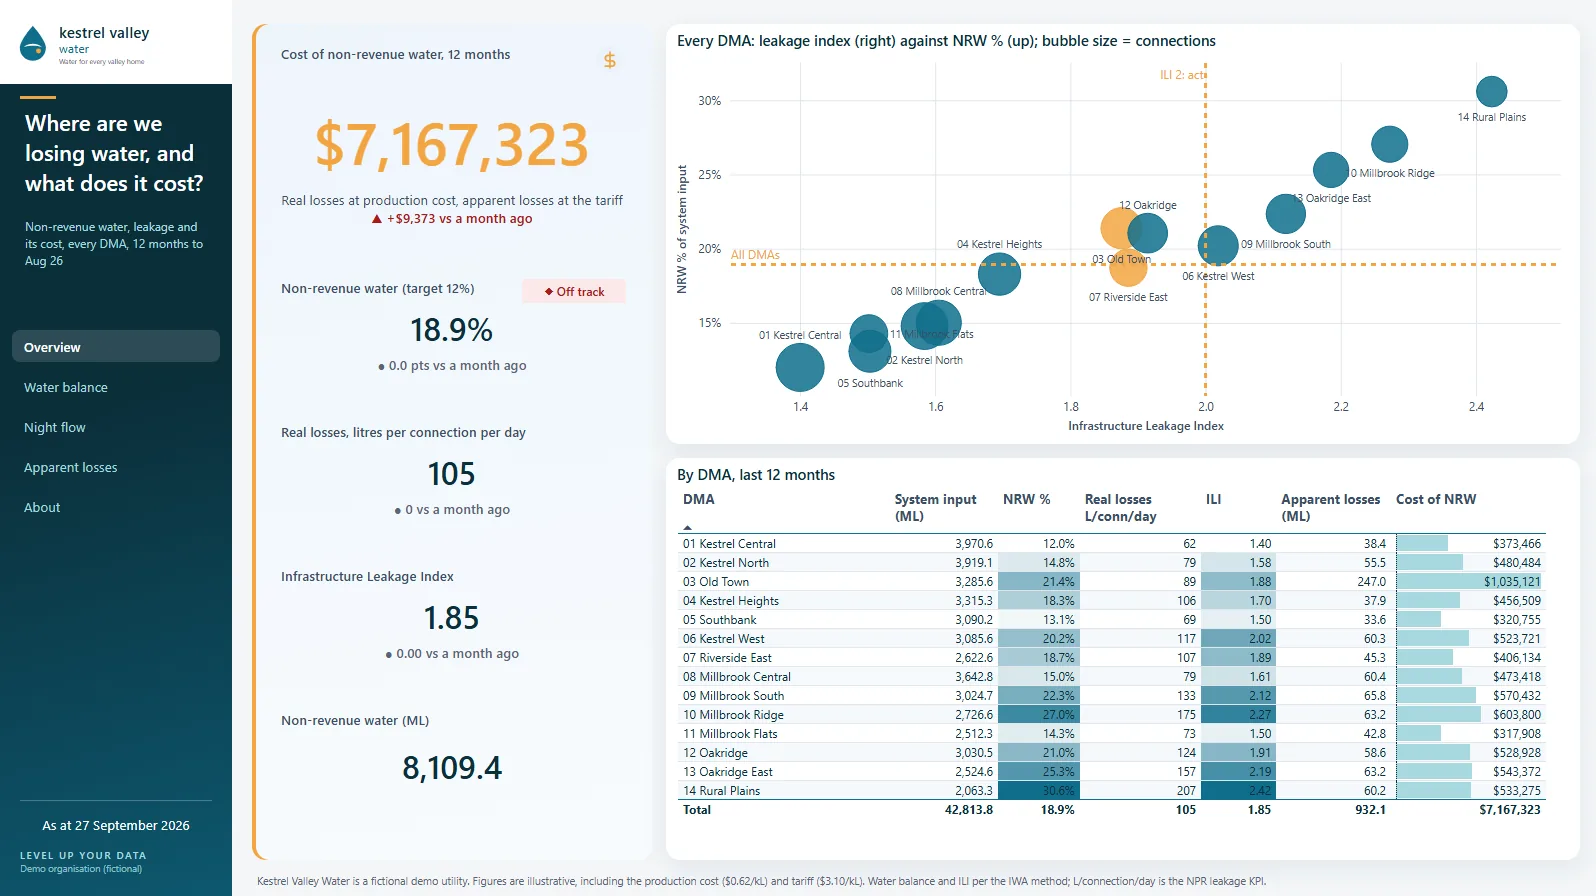
CEO and Executive GM Operations: Where are we losing water, and what does it cost? The IWA water balance for every DMA, its night flow and its apparent losses: Old Town’s old meters under-read, so its apparent losses are 9.6% of billed water, against 1.1% to 4.2% in other DMAs.
Leak detection
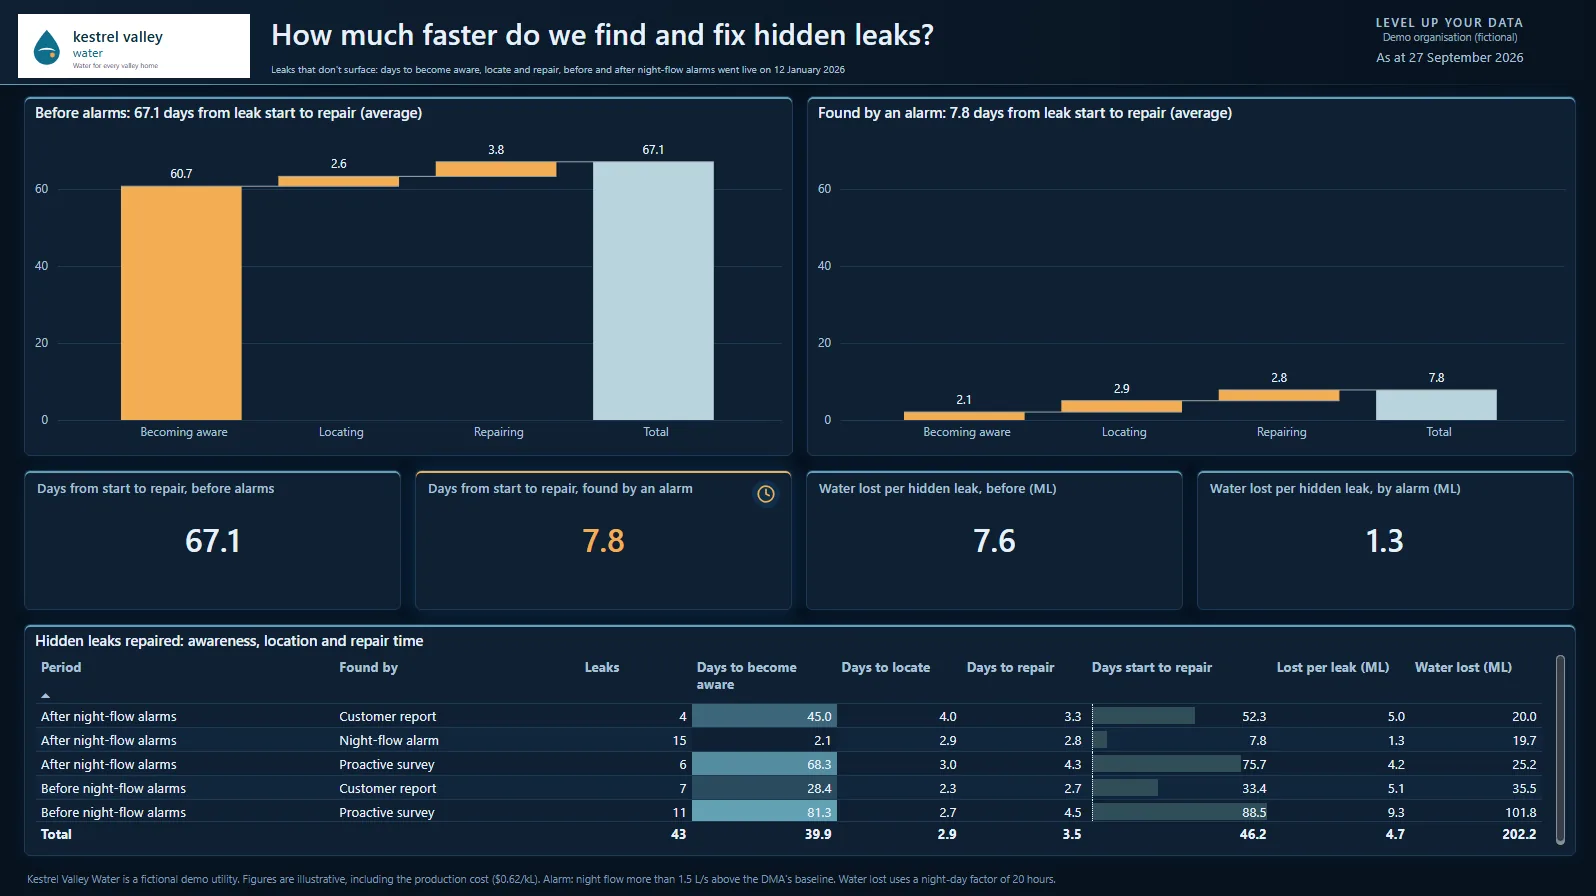
Network operations: Which DMAs have a leak tonight, and is anyone on it? Riverside East has been in alarm for 102 days, and nobody has raised a job.
NPR benchmark
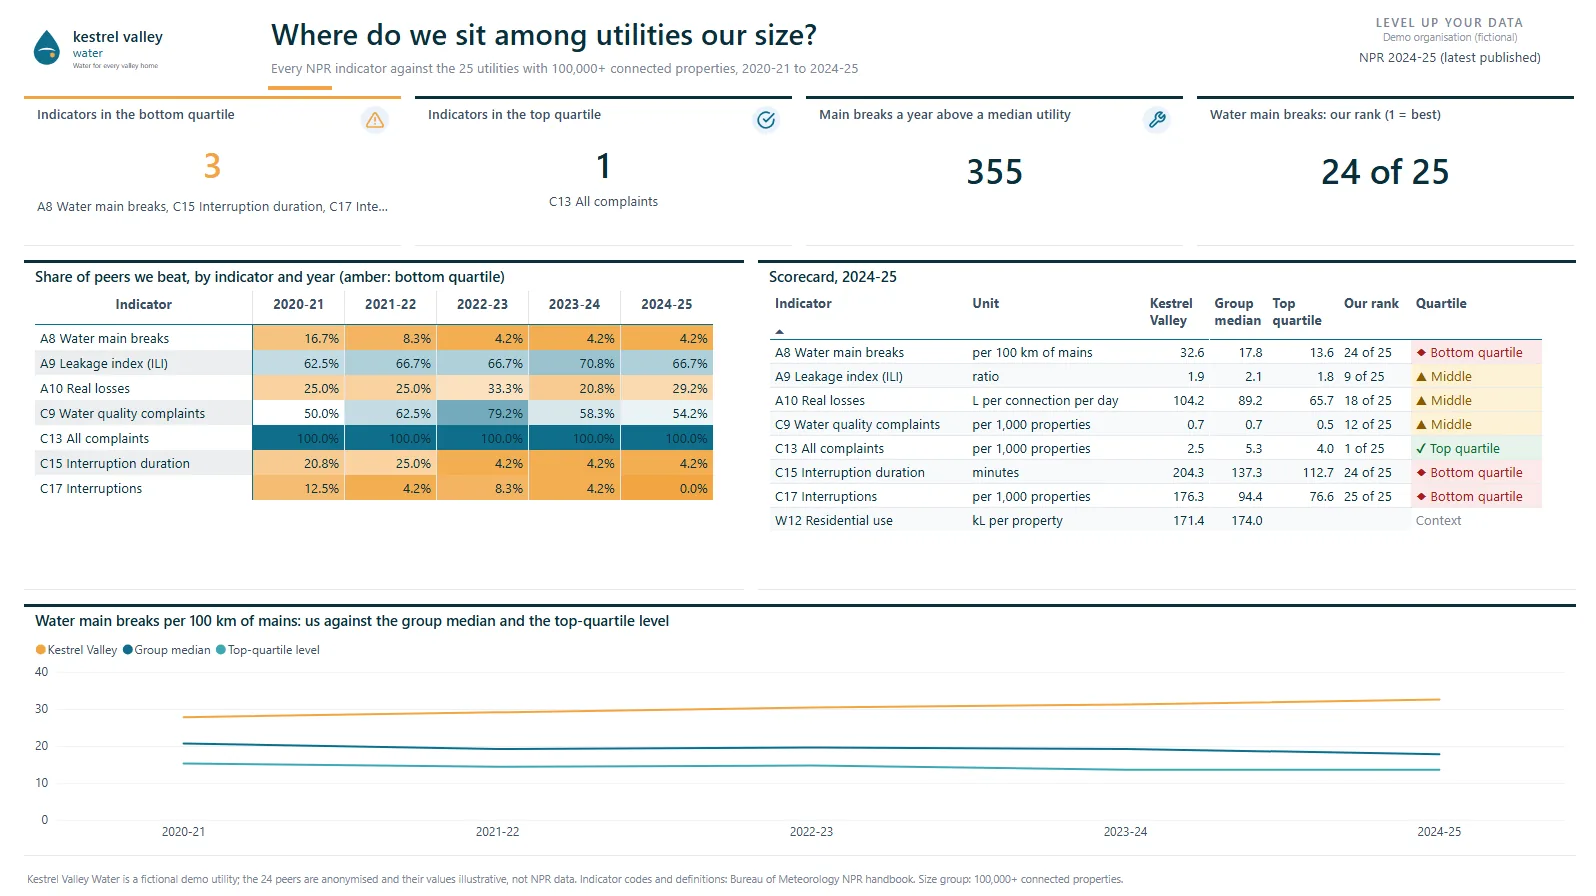
CEO and board: Where do we sit among utilities our size? Every National Performance Report indicator against the size group’s median and top quartile, its trend, and every peer side by side.
Hardship early warning
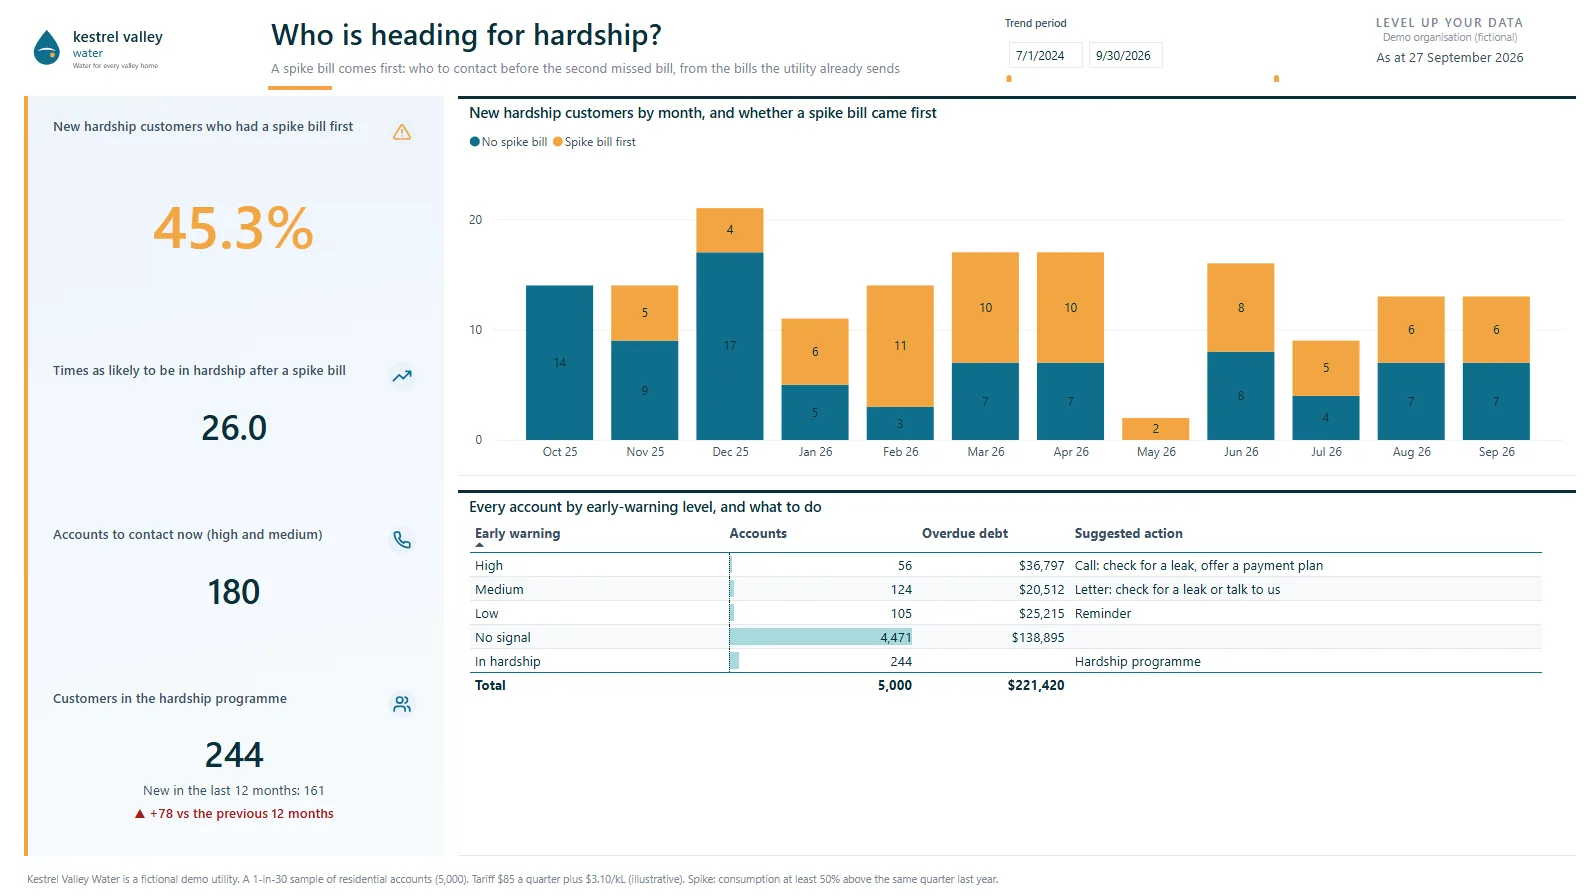
Customer and billing manager: Who is heading for hardship? The early-warning list of accounts with a spike bill, their overdue debt, and the suggested action for each, before the second missed bill.
Smart meter rollout
Metering program manager: Are we on plan, and when will we finish? 45% installed against a 58.5% plan: at the current rate the rollout finishes in June 2029, a year late, and Old Town is furthest behind at 10%.
Asset renewal
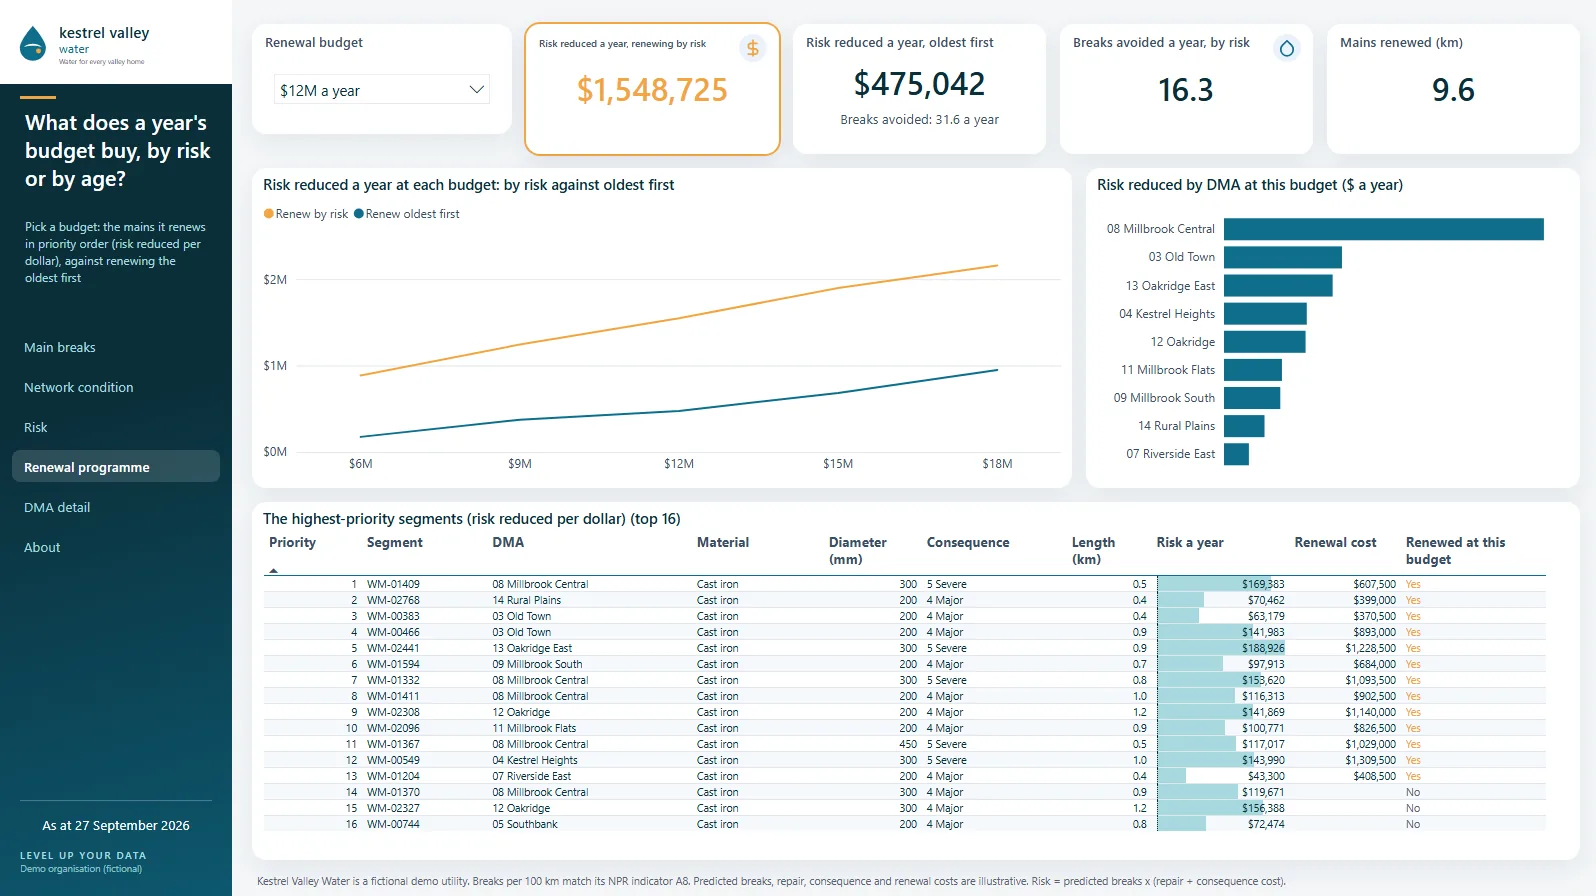
Asset manager: Are our mains breaking more, and where? Breaks by DMA, material and age, the riskiest mains, and what a year’s renewal budget buys. Cast iron is 16% of the network and 58% of breaks.
Sector pressures
Why isn’t an annual water balance enough any more?
Each pressure lives in a different system, and an annual figure joins them too late.
Water losses
Non-revenue water is part leakage and part meters and data errors, and only a water balance for each DMA says which (IWA method).
Benchmarking
The National Performance Report publishes every utility’s results each year, so boards and price submissions are judged against peers (Bureau of Meteorology).
Smart meter data
Rollouts bring hourly reads, alarms and data-quality checks that a quarterly billing system was never built for.
Customers
A leak on the private pipe can turn into a spike bill, then into debt and a hardship application.
Ageing mains
A renewal budget covers a small share of the network each year, so which mains come first matters.
Governance
Data your board can trust
The reports connect to the systems you already run: SCADA and the historian, billing, the smart meter head-end, GIS and the asset register, work management, and finance. Data in spreadsheets? We start from the spreadsheets. The model doesn’t change when the source improves.
- Every figure has an owner: the Executive GM Operations for the water balance, the customer and billing manager for billing and hardship, the asset manager for the register.
- Reconciled, not assumed: each DMA’s components add up to its system input every month, inflow meters are checked against calibration records, and finance figures are reconciled to the ledger.
- Private by design: volumes and breaks by DMA, with no customer names in the model.
Read more about our approach to data governance.
The pilot
How does a water utility pilot work?
A fixed-price pilot, 4–6 weeks, scoped with you in a free 30-minute meeting: one question, answered on your own data and reconciled to your own figures.
Good starting points are non-revenue water by DMA, owned by your Executive GM Operations, or the National Performance Report benchmark, owned by your CEO or regulatory lead, which starts from published data and your own submission. The report is tuned with whoever owns the question. See how we work for the week-by-week plan, and our tested delivery accelerators.
FAQ
Questions utilities ask
Each system reports on what it holds. SCADA knows what went into a DMA, billing knows what was charged, and the asset register knows what broke. Non-revenue water, a spike bill that turns into hardship, and the mains to renew next each need two or three of them together. Power BI joins them in one governed model, so the answer is there every week, not once a year.
No. Kestrel Valley Water is fictional, built on typical sector data, and every figure in the reports is illustrative, including the peer utilities in the benchmark. The methods are the sector’s own: the IWA water balance, the Infrastructure Leakage Index and the national indicator definitions. In a pilot, the same reports run on your own data and are reconciled to the figures you already report.
Yes. Each indicator is calculated as the Bureau of Meteorology’s indicators and definitions handbook defines it, from main breaks per 100 km (A8) to unplanned interruptions (C17), version by version. When the national report comes out, your submission is reconciled to the published figures, and your size group is checked each year. Peers can be shown by name or anonymised.
Hourly consumption is personal information, so the model aggregates it by DMA. The hardship early-warning list holds account numbers, not names or addresses, and row-level security shows it only to the customer team. Customers are contacted through that team, never from the report itself.
Yes. The water balance needs DMA inflow meters and billed volumes, which you have today whatever meter sits at each property. Quarterly bills are aligned to calendar months before the balance is struck, and hourly reads add detail as each DMA converts. The model stays the same, so new meters improve the reports without a rebuild.
Related
See every DMA in one view
A fixed-price pilot on your own data, 4–6 weeks. Start with a 30-minute meeting.