
Aged care analytics
Aged care analytics
Aged care analytics: see which homes are losing money, and why
For providers who need more than a monthly group average: Power BI reports that join your resident, roster, finance and government data to show every home, every week.
95.2%
sector occupancy in the nine months to March 2026, yet more homes are operating at a loss. Source: StewartBrown, March 2026
AUD 303.19
AN-ACC price per resident per day from 1 October 2026, up 2.55%. Source: IHACPA pricing advice 2026–27
215 / 44
care minutes and RN minutes per resident per day, plus a registered nurse on site 24/7. Source: Aged Care Quality and Safety Commission
24 hours
to notify a Priority 1 serious incident to the Commission. Source: Commission, SIRS
Sector facts as at September 2026.
Report examples
Ten aged care analytics reports on one fictional provider
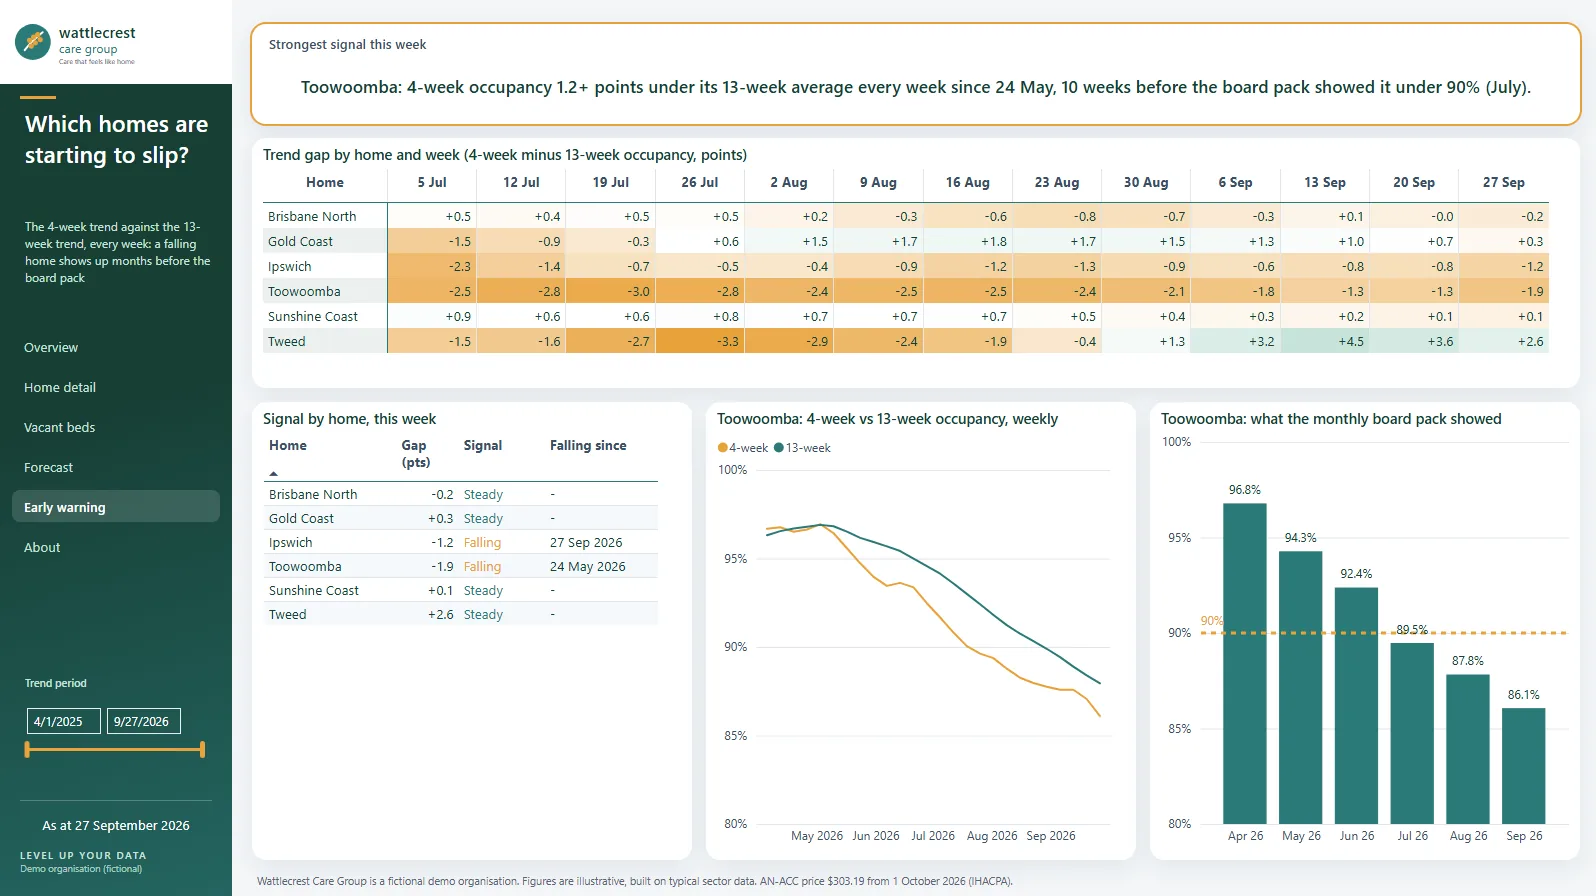
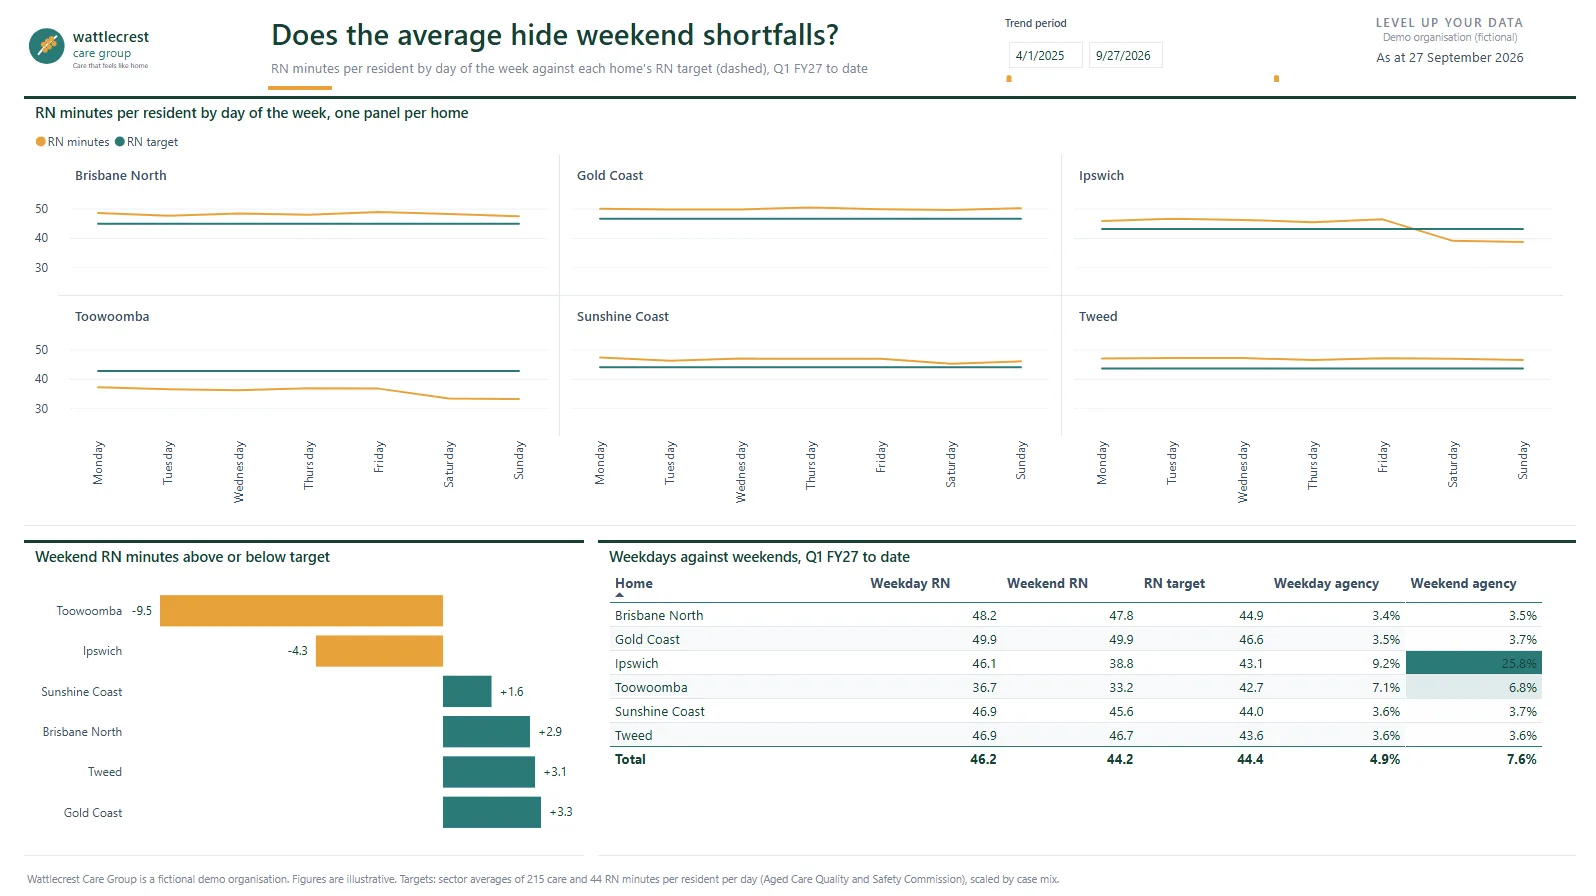
Wattlecrest Care Group is a fictional not-for-profit provider in South East Queensland and Northern NSW: six homes, 540 beds and about 1,150 Support at Home clients. All ten reports run on it, so the stories join up: Toowoomba’s occupancy slid after RN resignations, Ipswich leans on weekend agency staff, and two homes miss their RN targets at weekends. Watch one problem home show up in occupancy, staffing, quality and money.
Click a screen to see it full size.
Board pack
CEO and board: Are we safe, full and sustainable? Nine measures across occupancy and finance, care and quality, and workforce, each against its target, with the gaps furthest from target listed first.
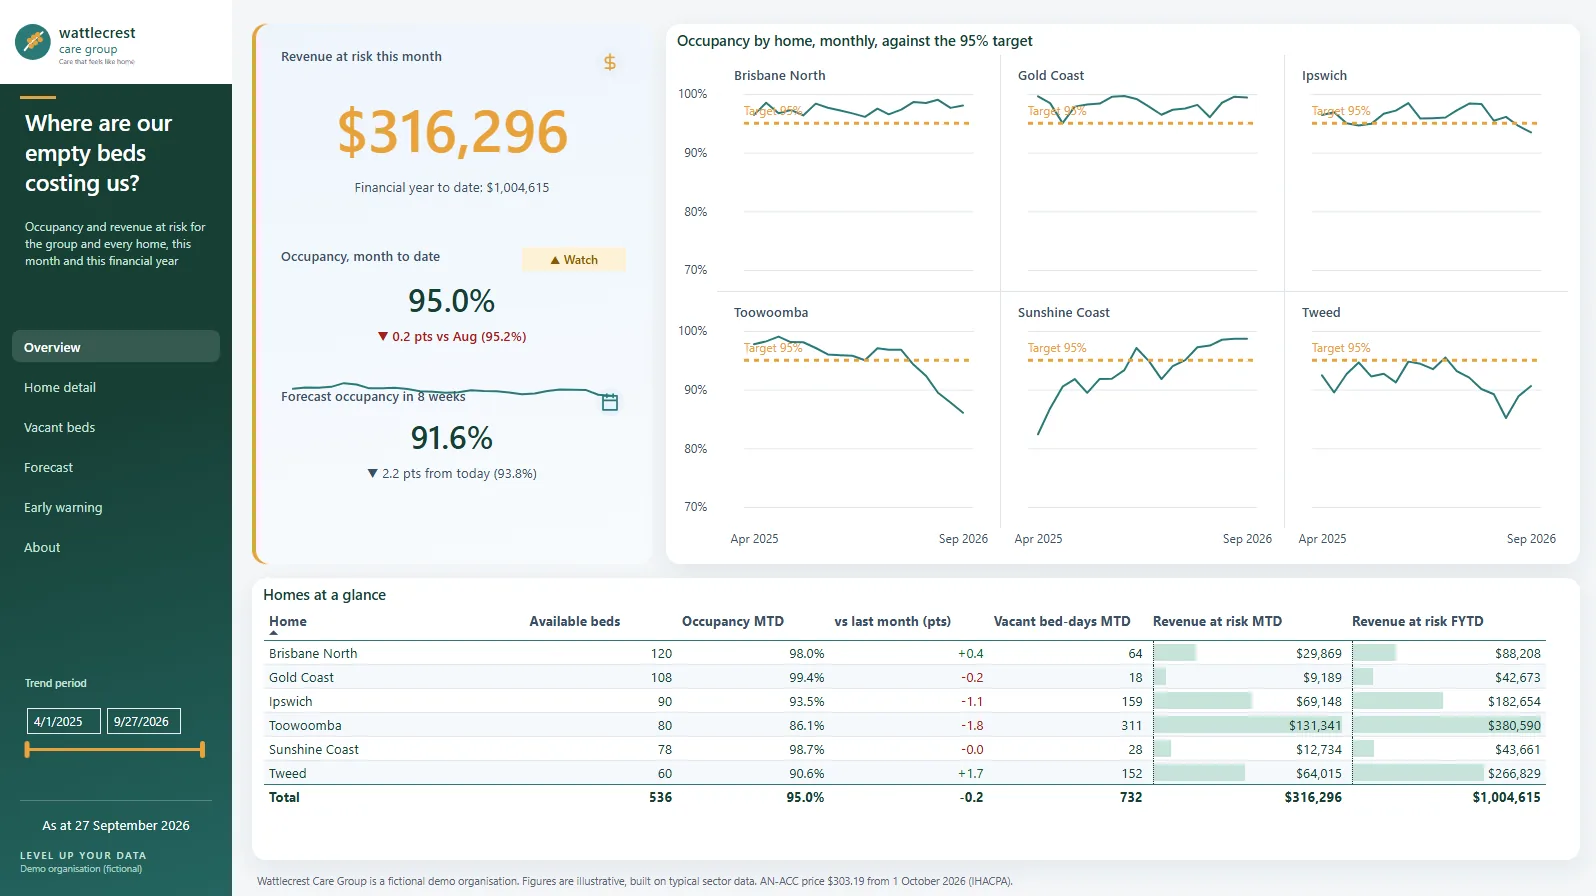
Occupancy and revenue at risk
CFO: Where are our empty beds costing us? Every home’s occupancy and revenue at risk, an 8-week forecast at the new AN-ACC price, and a weekly early warning.
Admissions pipeline
Admissions: How fast are we filling our empty beds? Toowoomba takes 46 days to fill a vacancy; the group takes 27.
Staffing to occupancy
GM Residential: Is staffing moving with occupancy? Over the last four weeks, against six months earlier, Toowoomba lost 12.5% of its residents but 27.6% of its RN hours.
Care minutes compliance
Director of Clinical Services: Is every home meeting its care minutes? Five of six homes comply; Toowoomba is 7 RN minutes a day short.
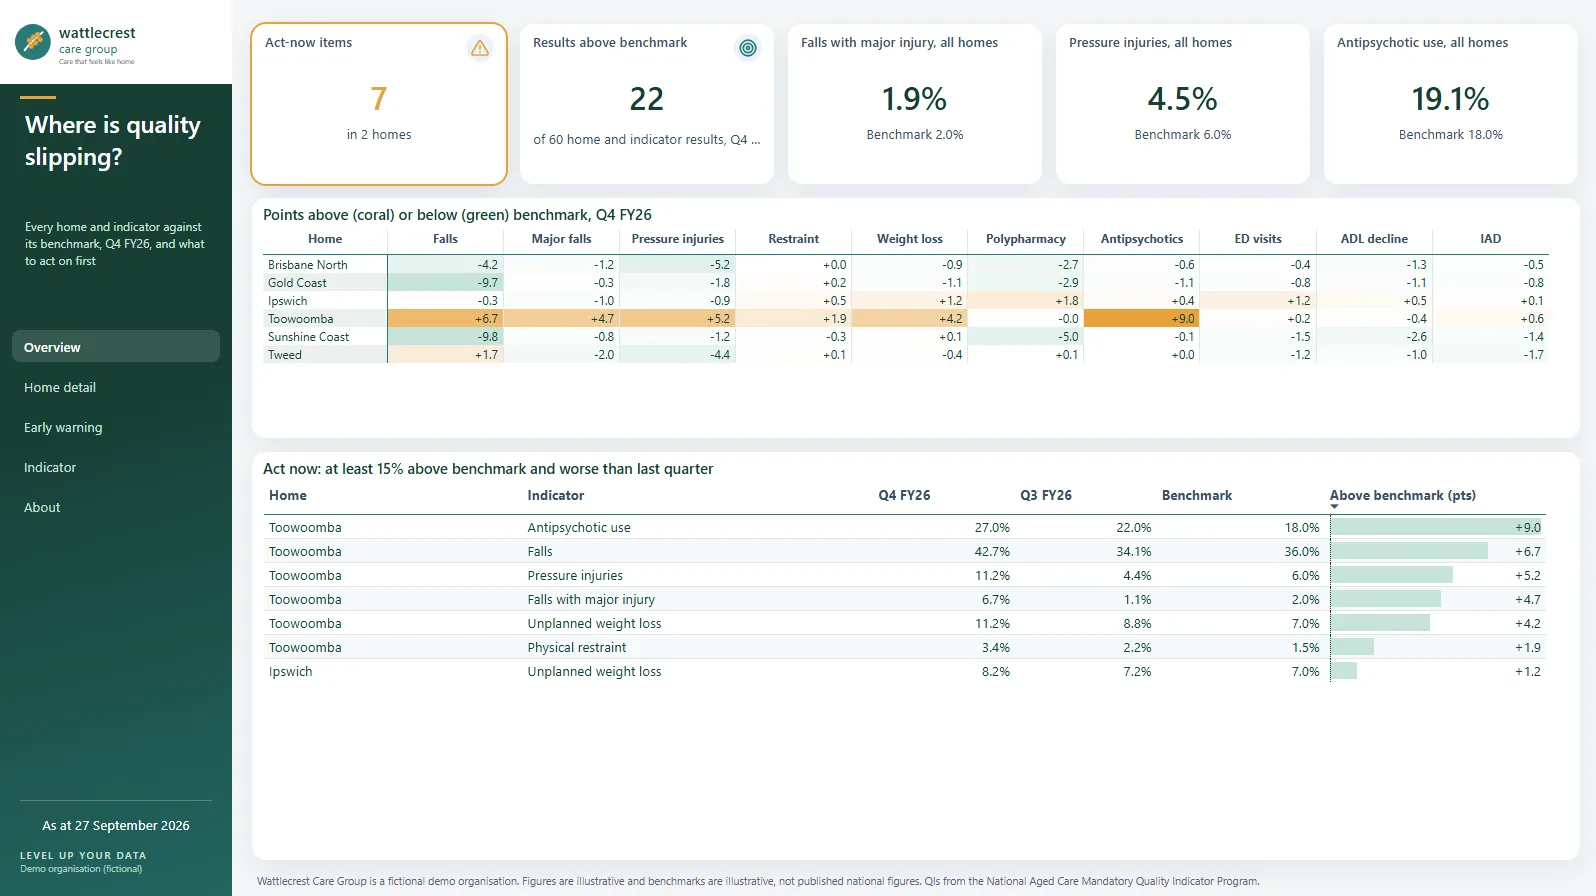
Quality indicators
Quality and Risk: Where is quality slipping? Toowoomba’s antipsychotic use is 27.0% against a benchmark of 18.0%, up from 22.0% last quarter.
Star Rating drivers
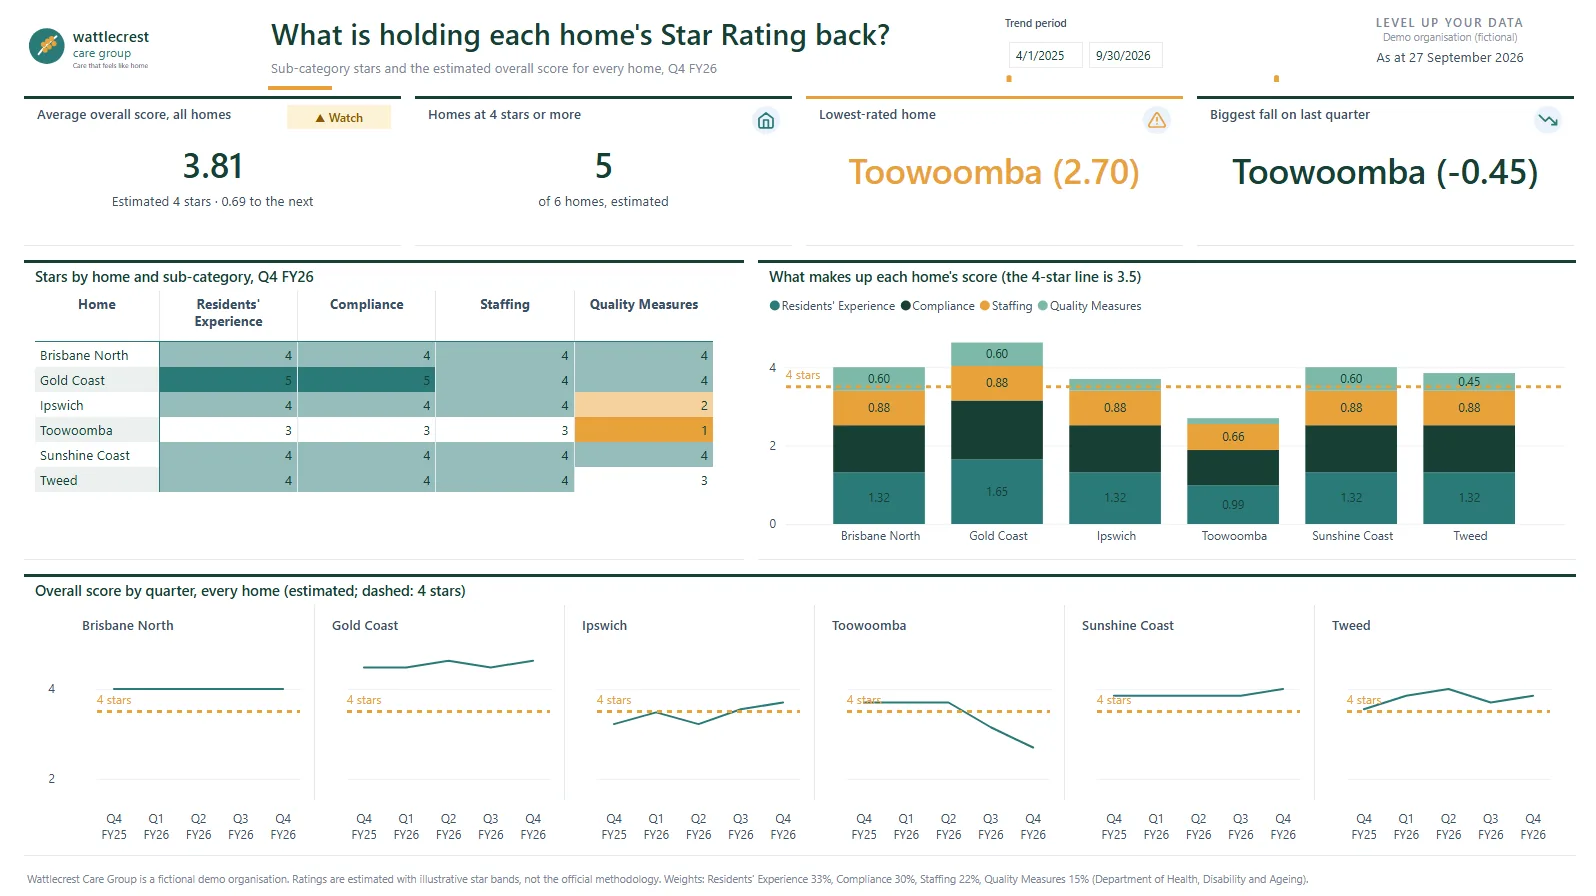
CEO and board: What is holding each home’s Star Rating back? Each home’s estimated rating, built up from its four sub-categories, with how the stars have moved and the one to lift first for the next star.
Funding vs cost of care
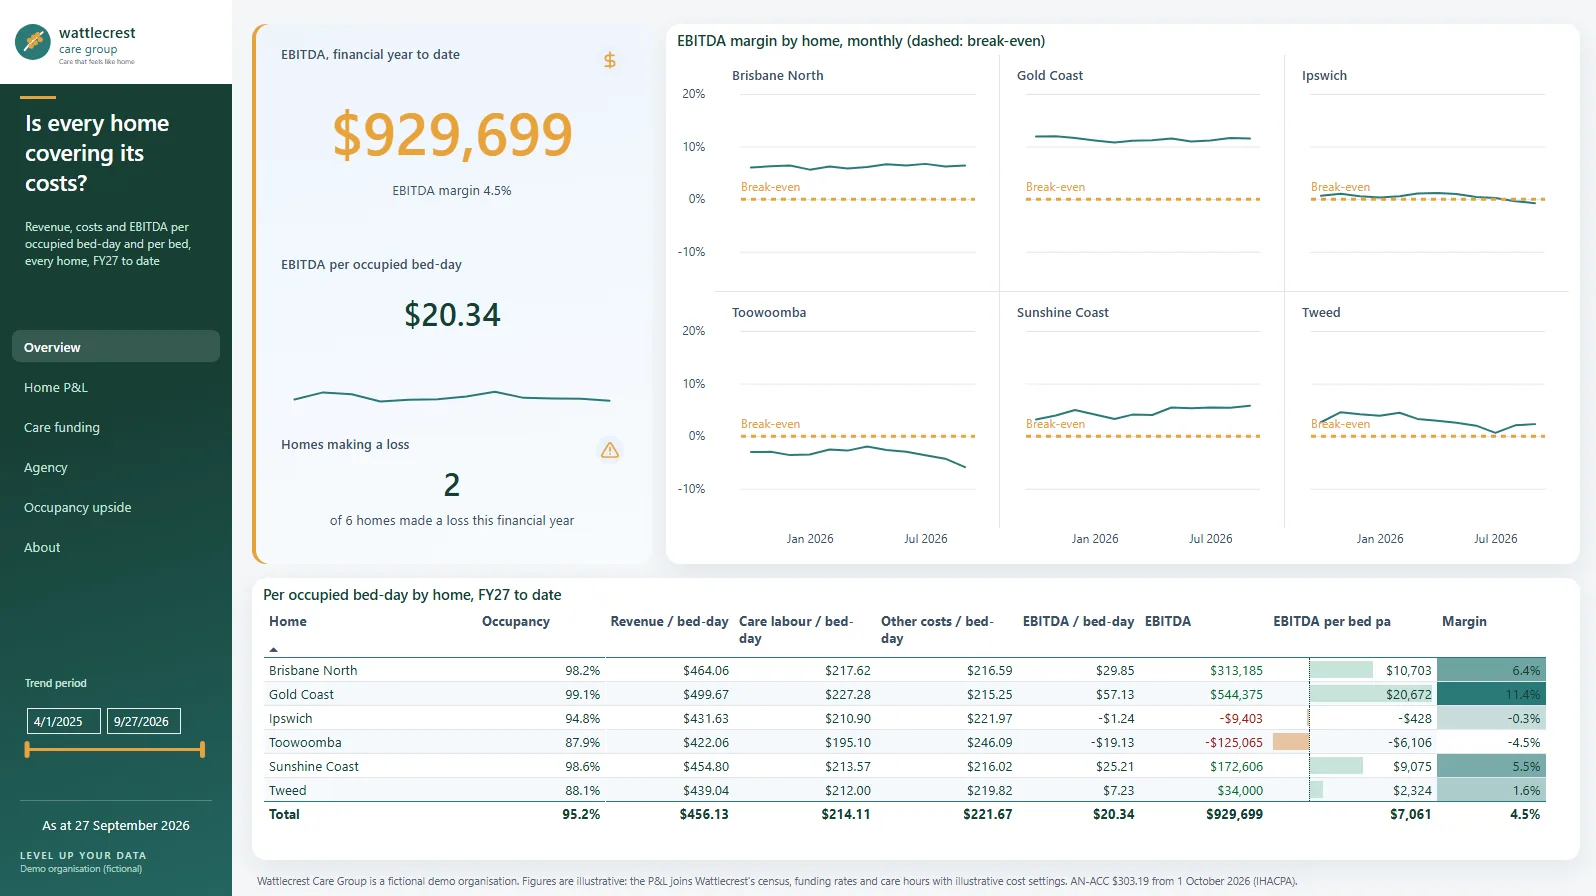
CFO: Is every home covering its costs? Funding against the cost of care for every home, per occupied bed-day and per bed, so a margin problem points to a home.
Support at Home budgets
Home care GM: How much budget are clients losing? 545 clients lost funds last quarter; 86 of the 90 now behind pace are in Toowoomba.
Incidents and SIRS
Quality and Risk: Where are incidents rising? 95.5% of SIRS incidents are notified on time; Toowoomba’s rate is rising.
Sector pressures
Why isn’t a monthly board pack enough any more?
Each pressure lives in a different system, and a monthly pack joins them too late.
Margins
High occupancy, yet more homes in the red: every empty bed-day and agency hour counts (StewartBrown; Inside Ageing).
Care minutes
A funding condition that also drives each home’s Staffing star rating (Commission).
The new Aged Care Act
Since 1 November 2025: strengthened Quality Standards, and SIRS in home care (ANMJ).
Support at Home
Quarterly budgets per client; unspent funds carry over only up to AUD 1,000 or 10%, whichever is greater (Department of Health, Disability and Ageing).
Quality and Star Ratings
14 quality indicators each quarter, and ratings families compare (QI reporting; Star Ratings).
Governance
Data your board can trust
The reports connect to the systems you already run: your care or resident management system, rostering and payroll, your CRM or admissions tracker, your finance system, and government statements. Data in spreadsheets? We start from the spreadsheets. The model doesn’t change when the source improves.
- Every figure has an owner: the CFO for rates and funding, the GM Residential for the census, the Director of Clinical Services for care minutes and incidents.
- Reconciled, not assumed: the census every day, care minutes to the Quarterly Financial Report before you submit it, SIRS notification times to the portal, and the model to your management accounts at month-end.
- Private by design: no resident or staff names in the model and each facility manager sees only their own home.
Read more about our approach to data governance.
The pilot
How does an aged care pilot work?
A fixed-price pilot, 4–6 weeks, scoped with you in a free 30-minute meeting: one question, answered on your own data and reconciled to your own figures.
Good starting points are occupancy and revenue at risk, owned by your CFO, or care minutes compliance, owned by your Director of Clinical Services. The report is tuned with whoever owns the question. See how we work for the week-by-week plan, and our tested delivery accelerators.
FAQ
Questions providers ask
Your care system reports on what it holds. Board questions cross systems: occupancy against funding, rosters against care minutes, staffing against falls and Star Ratings, across every home and over time. Power BI joins your care, rostering, finance and government data in one governed model, so a slipping home shows up in weeks, and nobody rebuilds the board pack by hand.
No. The provider in the reports is fictional, built on typical sector data, and every figure in them is illustrative. The sector facts on this page, such as the AN-ACC price and care minutes targets, come from government and industry sources, linked and dated. In a pilot, the same reports run on your own data and are checked against the numbers you already report.
Most views don’t need resident names at all, so the model holds pseudonymised identifiers and counts by home. Row-level security limits a facility manager to their home’s figures, and finance pages can be restricted by role. Prospective residents’ details stay in your CRM; the model holds only dates and stages.
Yes. Care minutes use worked direct-care hours, with leave and training excluded, against each home’s targets for the quarter. Enrolled nurses can count towards up to 10% of the RN target. In week one we confirm these rules with you, then check the totals against your Quarterly Financial Report every quarter, ahead of submission.
Yes. The Support at Home report tracks each client’s quarterly budget during the quarter, flags clients behind pace before unspent funds above the carry-over cap are lost, and gives care managers a list of clients to contact. The board pack example shows residential homes only; yours can include both.
Related
See every home in one view
A fixed-price pilot on your own data, 4–6 weeks. Start with a 30-minute meeting.