
Industries
Industries
Industry data analytics for aged care, water, charities and councils
Power BI reports for boards in aged care, water utilities, not-for-profits and councils. They’re already built, so you see the answers to your board’s hardest questions before an engagement starts.
Board packs
Four sectors, 30 Power BI reports
Industry data analytics starts with what each sector is up against. The gallery below shows the first page of each board pack: a real Power BI report on a fictional organisation built on typical sector data.
Aged care
Residential care is funded per resident per day, so occupancy drives revenue while staffing costs are largely fixed and mandated. Occupancy is high, yet more homes are running at a loss (StewartBrown, March 2026).
Built for Wattlecrest Care Group: six homes, 540 beds. 10 reports.
Water utilities
Every utility is benchmarked each year in the Bureau of Meteorology’s National Performance Report (2024–25 edition), and smart meters now add hourly interval data to the picture.
Built for Kestrel Valley Water: about 180,000 connections, 14 district metered areas. 7 reports.
Not-for-profit
Funders want outcomes, not activity counts. Grants have to be acquitted on time, and regular givers can lapse without anyone noticing.
Built for Harbourlight Community Services: about AUD 48 million revenue a year, 55,000 donors. 6 reports.
Local government
Customer requests, grant-funded capital works with fixed deadlines and workforce shortages all compete for the same budget, and councillors see them in separate reports.
Built for Ashford Vale Regional Council: about 85,000 residents across three towns. 7 reports.
Click a screen to see it full size.
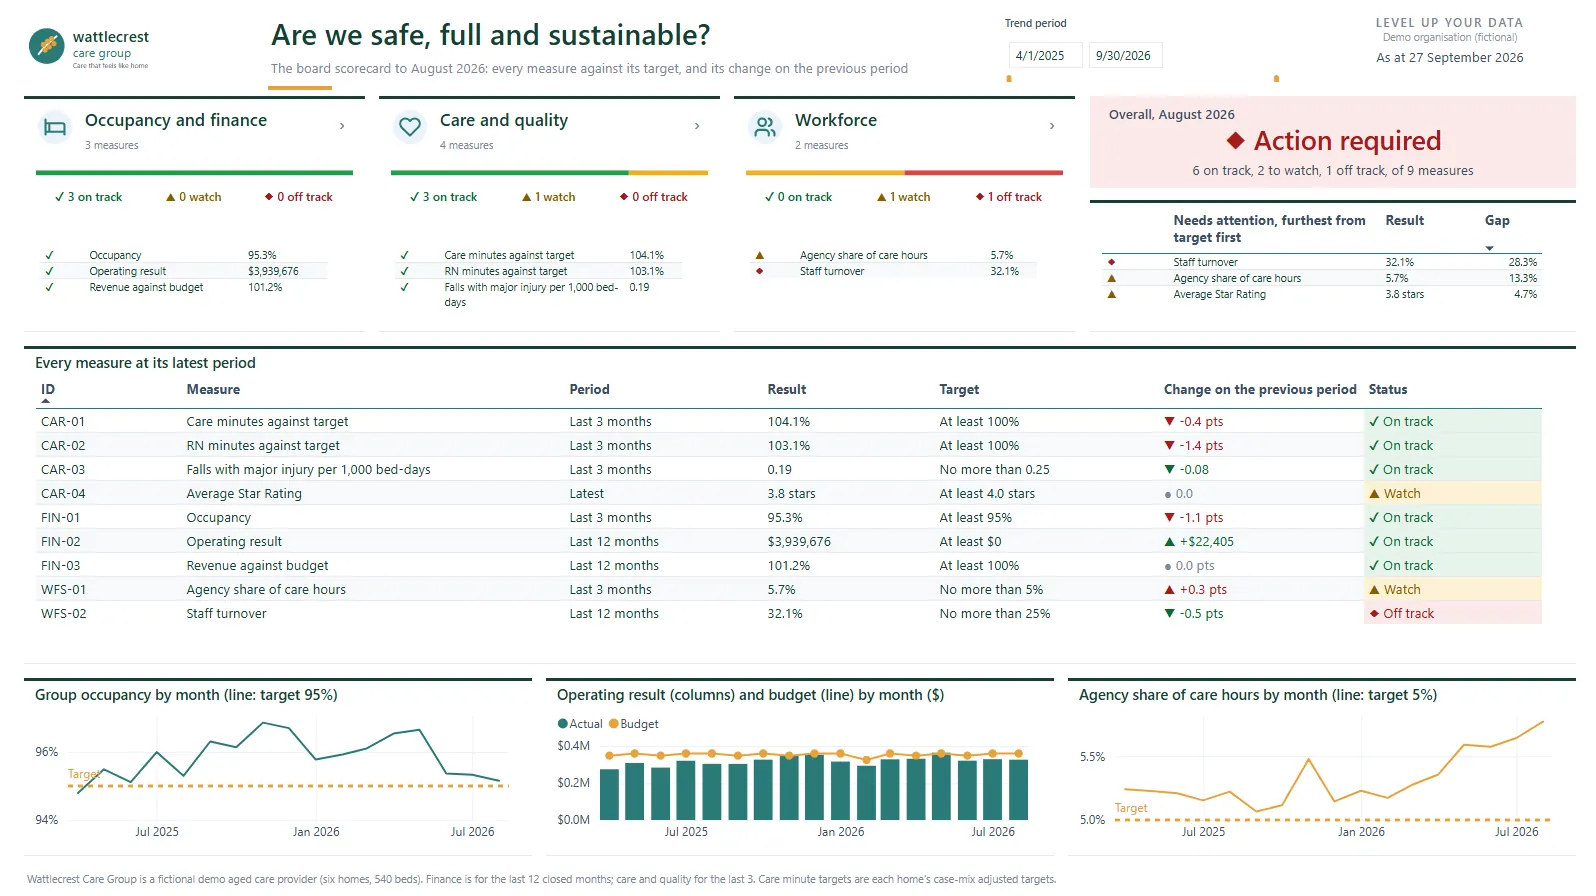
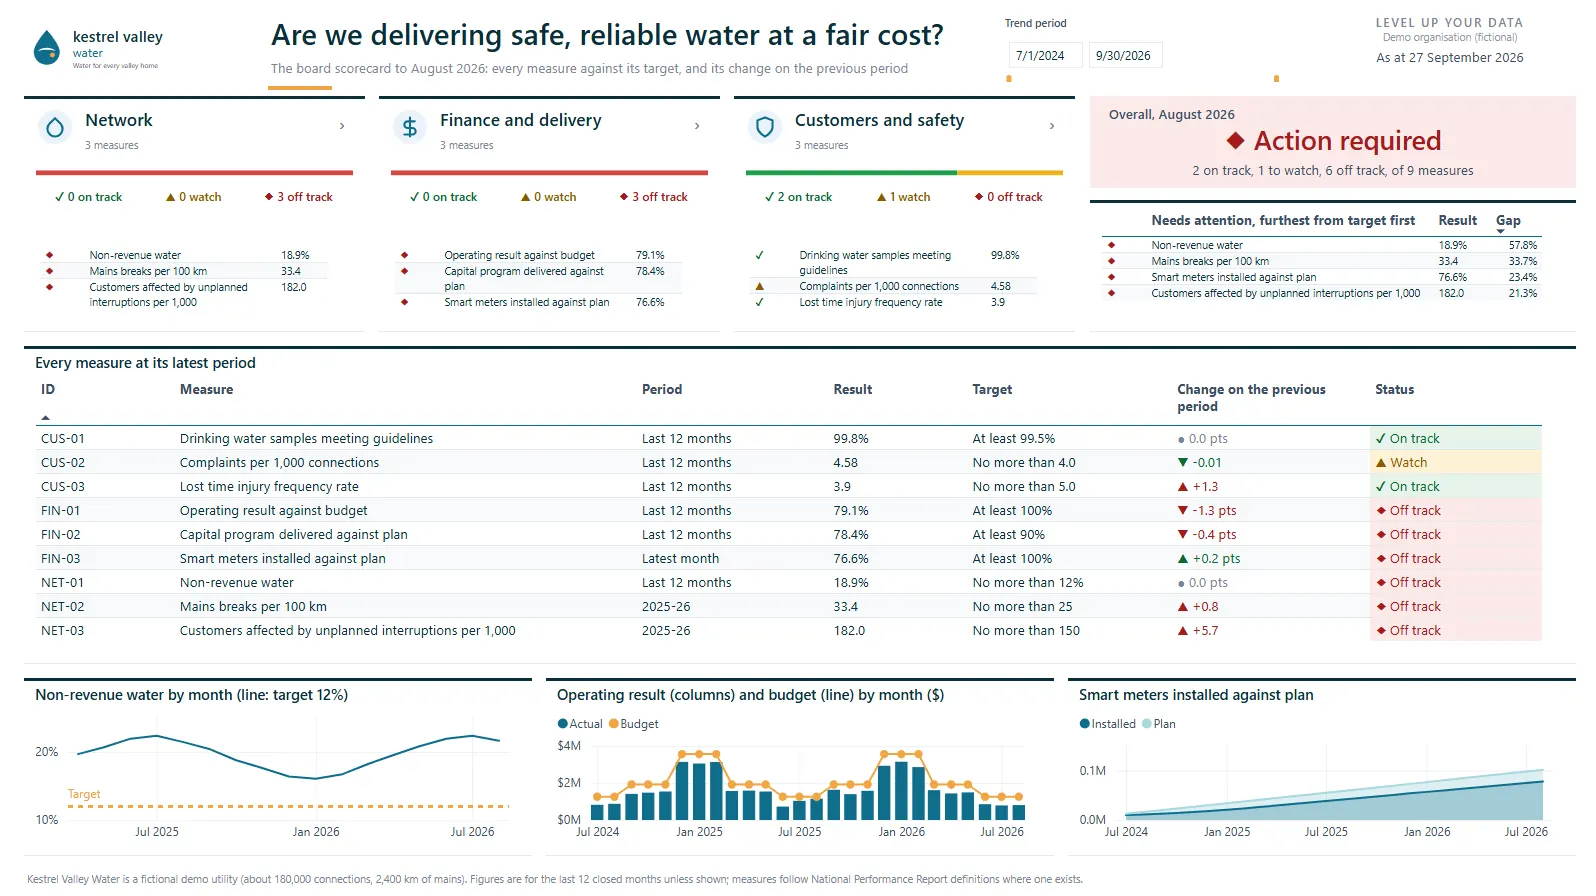
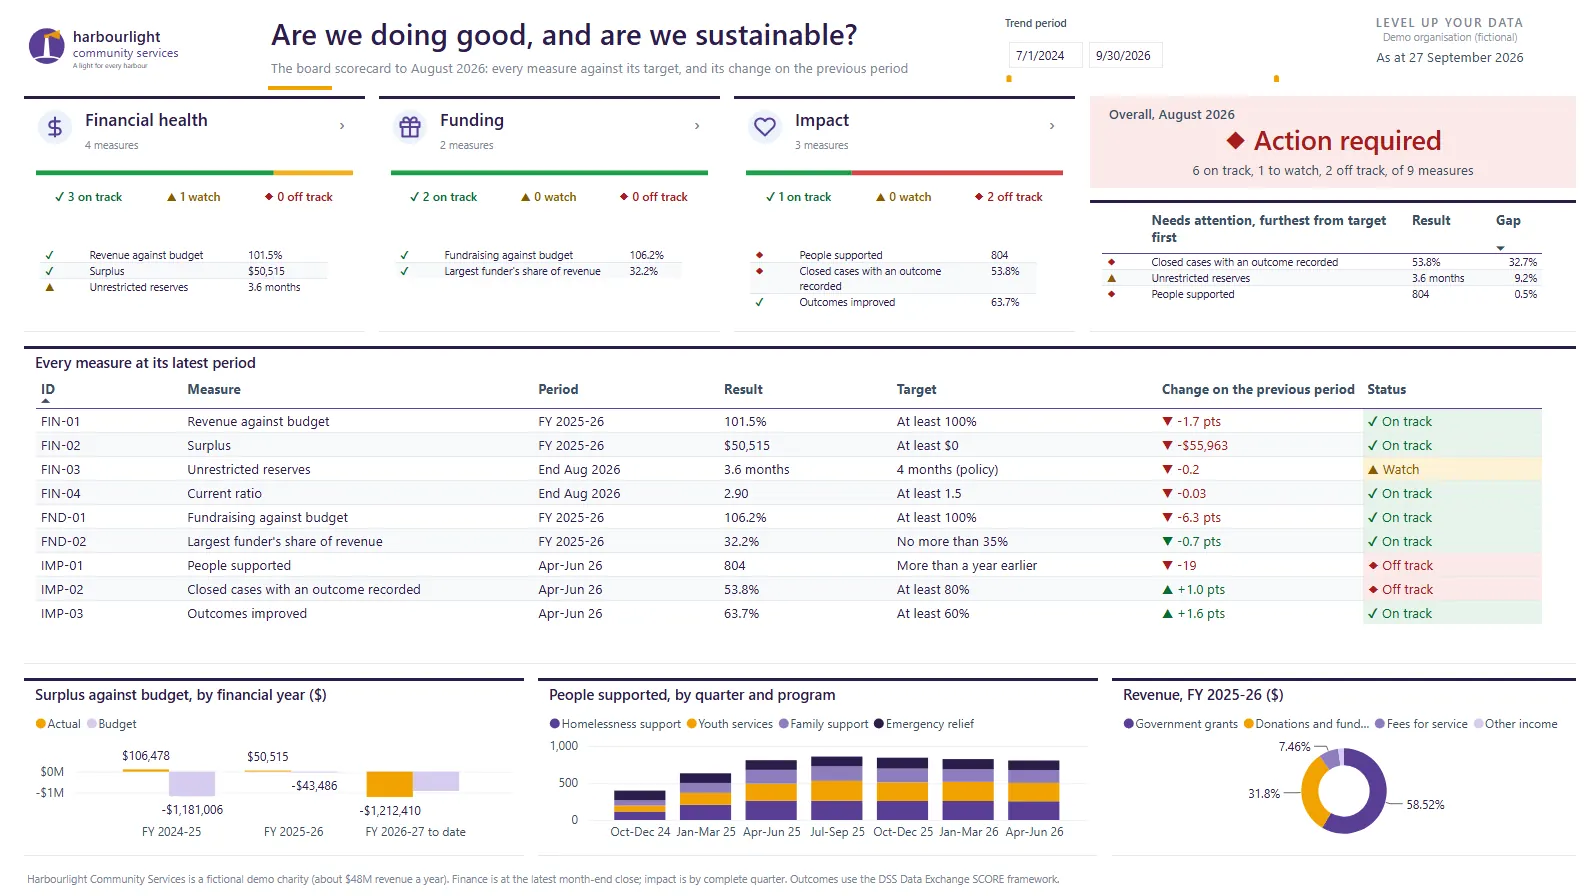
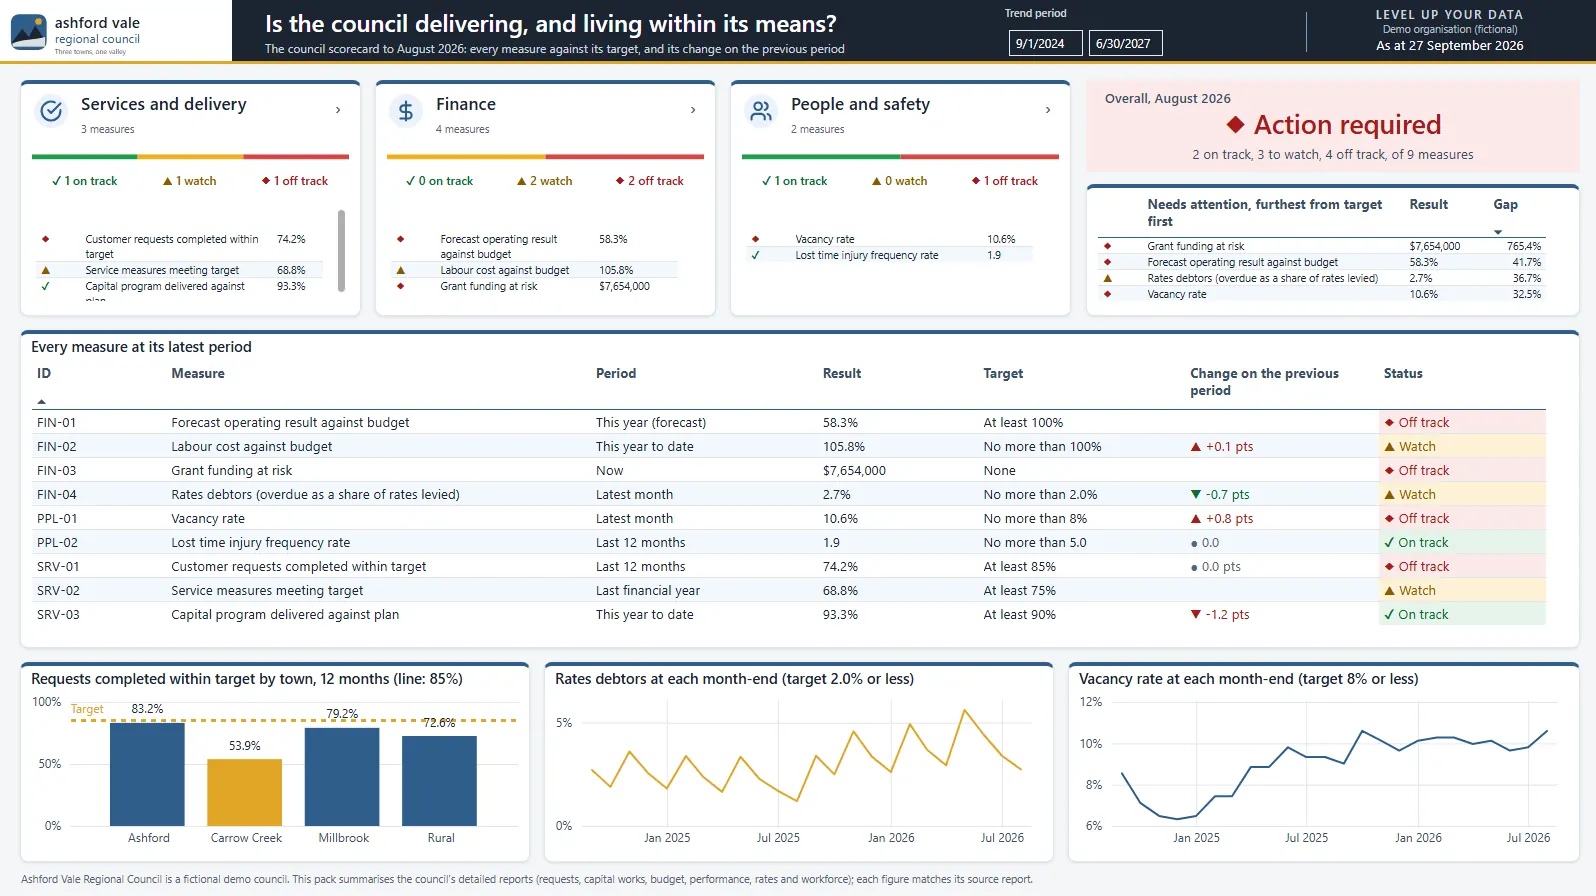
Wattlecrest Care Group, Kestrel Valley Water, Harbourlight Community Services and Ashford Vale Regional Council are fictional organisations built on typical sector data. Figures in the reports are illustrative; sector facts are sourced.
Not in these four sectors?
These are the four sectors where we’ve built complete sets of reports ahead of time, but our services aren’t tied to a sector. See our data analytics services, data governance and data maturity assessment, or contact us and we’ll show you the closest match.
How an engagement runs
It starts with a free 30-minute meeting where we show you the reports for your sector. Then a fixed-price pilot, 4–6 weeks, scoped with you, builds the report you choose on your own data and reconciles it to your own figures. After that, we build the rest, and if you want it, run it for you as analytics as a service. Read how we work and how our tested delivery accelerators keep delivery fast and consistent.
FAQ
Questions we’re asked
No. All four are fictional, and we checked that no organisation in the sector uses their names. Their data is built on typical sector patterns and the figures are illustrative. The sector facts around them, such as funding rates, care minute targets and national benchmarks, are real, and we link their sources on this page and on the aged care analytics page.
The ones you already run. In aged care, that’s care management, rostering, payroll and finance. In water, it’s SCADA, bulk meters, billing and asset management. For charities, it’s finance, the grants register and case management. For councils, it’s customer requests, finance, rating and HR. If some of your data lives in spreadsheets, we start from the spreadsheets.
Yes. In a 30-minute meeting we open any of the reports in Power BI and click through them with you, page by page, and talk through how they would work on your data. The reports sit in private workspaces, so there’s no public link to share, but the meeting is free and you choose which reports we show.
Tell us your sector’s hardest question
We’ll show you the report that answers it, then scope a fixed-price pilot on your own data.