
Delivery accelerators
Delivery accelerators
Microsoft Fabric accelerator: your first report on your own data in 4–6 weeks
Our Microsoft Fabric accelerator is the set of tested delivery patterns we reuse on every engagement, so a fixed-price pilot of 4–6 weeks, scoped with you, goes on your data and your question, not on plumbing.
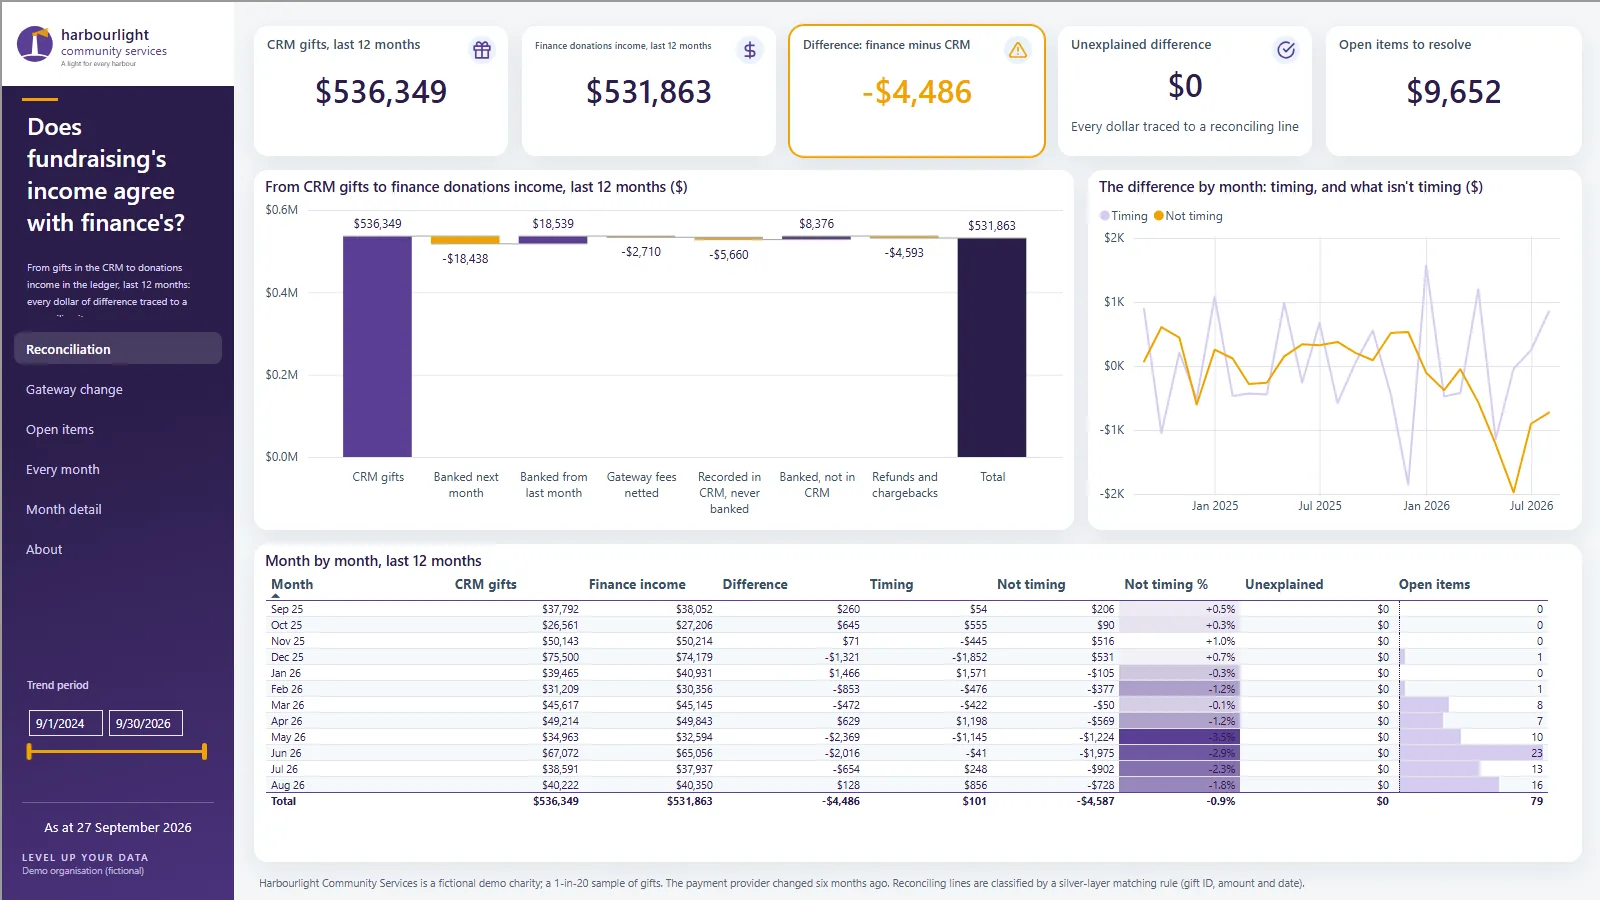
Harbourlight Community Services is a fictional charity built on typical sector data. Figures are illustrative.
Outcomes
What an accelerator means for you
Ours is aimed at one business question, answered on your real data, with proof the numbers are right.
Your question answered sooner
The pilot’s weeks go on your data and your report, not on building the basics from scratch. In 4–6 weeks you have one working report on your own data.
Numbers you can check
Every figure is reconciled to your own reports before anyone relies on it. If something doesn’t match, you get the reason, not a shrug.
Consistent and governed
The same structure, naming, logging and security on every source and every table, so the second report is built like the first and your team can find its way around.
Yours to keep
The pipelines, the warehouse, the model and the report are delivered into your own Microsoft tenant, with documentation. There’s no product licence to buy from us.
The patterns
What’s in the Microsoft Fabric accelerator
Four stages, from your source systems to a report your board can rely on.
1. Assess and connect
A snapshot of your data maturity, then data from your systems’ APIs and files landed safely in staging. Passwords and keys stay in Azure Key Vault, never in code, and every run is logged.
2. Warehouse and model
A star schema that keeps the history of changes, with loads that are safe to re-run, and one semantic model with a consistent library of measures, including time comparisons and targets.
3. Report and proof
A Power BI report built from a design you’ve agreed, then reconciled: counts, keys, totals, freshness and business rules, with the root cause of anything that doesn’t match.
4. Release and handover
Separate development, test and production, with a dry run and a backup before each deployment. Then a runbook, a data flow description and a data dictionary, written from what was built.
The pilot
How the patterns shape a pilot
The pilot is fixed-price, 4–6 weeks, and scoped with you. Here’s which patterns do the work in each stage.
- Weeks 1–2: the ingestion patterns land your data in staging.
- Weeks 3–4: the warehouse and model patterns build on your real data, and the reconciliation checks prove it against your own figures.
- Weeks 5–6: the release patterns take the report through test to production, with its documentation.
Read more about how we work, from the first meeting to analytics as a service.
Report examples
See what the patterns build
Our 30 Power BI report examples were built with these same patterns, on fictional organisations in aged care, water utilities, not-for-profits and local government. In a meeting, we can also show you each report’s About page: where its data comes from and how it’s governed. Start with aged care analytics to see a full set for one sector.
Services
Where the accelerator fits
The accelerator sits alongside our data architecture and data governance services. If your team wants to build and run it themselves, Microsoft Fabric training covers the platform they’ll be working in.
FAQ
Questions about the accelerator
You need a data platform for the pipelines and the warehouse: a Microsoft Fabric capacity or, if your organisation already runs it, Azure Databricks with Unity Catalog, so you don’t have to change platforms. Power BI Pro or Premium Per User are the licences people use to view and share the reports. Which combination fits depends on your data and your users, and we work it out with you when we scope the pilot.
Passwords and keys are read at run time from Azure Key Vault and are never written into code. Your data stays in your own Microsoft tenant. Where different people should see different data, such as a manager who sees only their own site, we add row-level security to the model.
The reconciliation checks can keep running after handover, so a mismatch shows up as a failed check when the data refreshes, not as a surprise in a board paper. The difference is then fixed at its source, never by adjusting the report.
Either. Your team can build the next reports from the same documentation and the same development, test and production set-up we used. Or we keep building and running it with you, as analytics as a service.
Often, yes. The patterns start from your source systems and staging tables, and an existing warehouse can be one of those sources rather than something to replace. Every organisation’s set-up is different, so we look at what you already have when we first meet and confirm the approach before the pilot is scoped and priced.
Start with one question, answered on your data
Tell us the question your board keeps asking. In a 30-minute meeting, we’ll show you a report that answers it for an organisation like yours, and how a pilot would get it running on your own data.